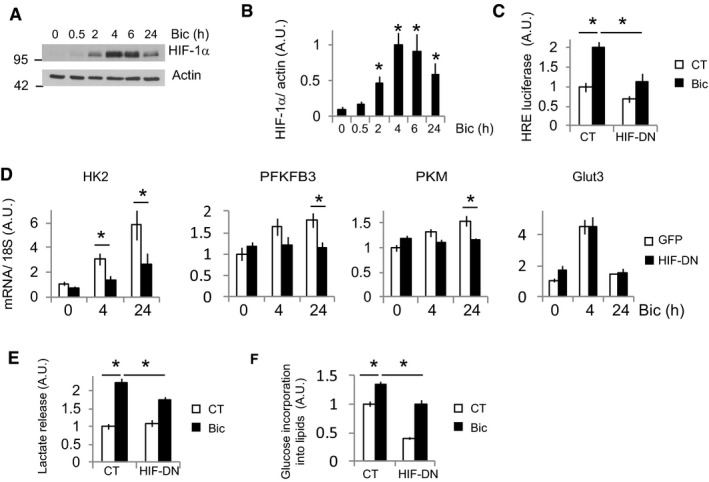
Figure 3. Activity‐dependent induction of glycolysis genes depends on HIF‐1α stabilization.

- Cortical neurons were stimulated with Bic+4‐AP over various time points, and the HIF‐1α protein was analyzed by Western blotting (n = 5 independent experiments).
- Densitometric analysis of HIF‐1α expression in (A). Values represent mean ± s.e.m. *P < 0.05, two‐tailed Student's t‐test.
- Luciferase‐based HIF‐1α activity in neurons expressing a control plasmid (globin) or a dominant‐negative HIF‐1α (HIF‐DN) and stimulated with Bic+4‐AP for 8 h (n = 4 independent experiments). Values represent mean ± s.e.m. *P < 0.05, one‐way ANOVA followed by Tukey post hoc test.
- Cortical neurons were transduced with AAV expressing HIF‐DN or control (GFP), stimulated for 4 or 24 h with Bic+4‐AP, and the mRNA expression of the indicated genes was analyzed by qPCR (n = 5 independent experiments). Values represent mean ± s.e.m. *P < 0.05, one‐way ANOVA followed by Tukey post hoc test.
- Lactate released into the medium by neurons transduced with AAV expressing HIF‐DN or control (GFP) after 24 h stimulation with Bic+4‐AP (n = 3 independent experiments). Values represent mean ± s.e.m. *P < 0.05, one‐way ANOVA followed by Tukey post hoc test.
- 14C‐U‐glucose incorporation into lipids in neurons transduced with AAV expressing HIF‐DN or control (GFP) and stimulated for 48 h with Bic+4‐AP (n = 4 independent experiments). Values represent mean ± s.e.m. *P < 0.05, one‐way ANOVA followed by Tukey post hoc test.
Source data are available online for this figure.
