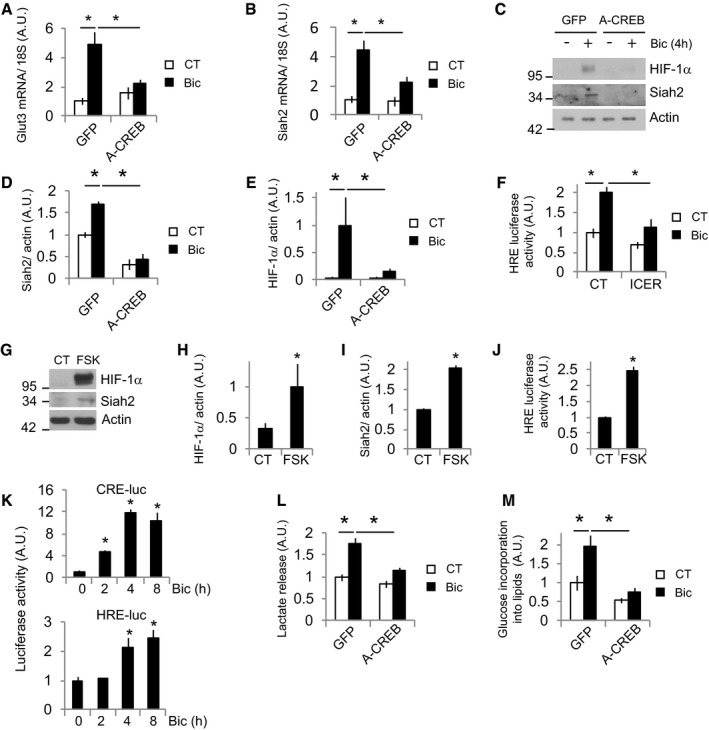
Figure 5. Glut3 and Siah2 expressions are regulated by CREB .

-
A, BCortical neurons transduced with AAV expressing GFP (control) or dominant‐negative A‐CREB were stimulated with Bic+4‐AP for 4 h before analyzing the mRNA expression of (A) Glut3 and (B) Siah2 by qPCR (n = 5 independent experiments). Values represent mean ± s.e.m. *P < 0.05, one‐way ANOVA followed by Tukey's post hoc test.
-
C–E(C) Representative Western blot and (D and E) densitometric analyses of the indicated proteins of neurons transduced with AAV expressing GFP or A‐CREB and stimulated with Bic+4‐AP for 4 h (n = 3 independent experiments). Values represent mean ± s.e.m. *P < 0.05, one‐way ANOVA followed by Tukey post hoc test.
-
FLuciferase‐based HIF‐1α activity in neurons expressing a control plasmid (globin) or a CREB inhibitor ICER and stimulated with Bic+4‐AP for 8 h (n = 5 independent experiments). Values represent mean ± s.e.m. *P < 0.05, one‐way ANOVA followed by Tukey's post hoc test.
-
G–ICREB activator forskolin (FSK) was sufficient to induce Siah2 expression and stabilize HIF‐1α. (G) Representative Western blot and (H and I) densitometric analysis of neurons treated with 10 μM forskolin for 4 h (n = 3 independent experiments). Values represent mean ± s.e.m. *P < 0.05, two‐tailed Student's t‐test.
-
JLuciferase‐based HIF‐1α activity in neurons treated with forskolin for 8 h (n = 4 independent experiments). Values represent mean ± s.e.m. *P < 0.05, two‐tailed Student's t‐test.
-
KCREB activation temporally precedes HIF‐1α activation. Luciferase‐based CREB and HIF‐1α activity at different time points after Bic+4‐AP stimulation (n = 4 independent experiments). Values represent mean ± s.e.m. *P < 0.05, two‐tailed Student's t‐test.
-
LLactate released into the medium by neurons transduced with AAV expressing A‐CREB or control (GFP) after 24 h stimulation with Bic+4‐AP (n = 5 independent experiments). Values represent mean ± s.e.m. *P < 0.05, one‐way ANOVA followed by Tukey post hoc test.
-
M14C‐U‐glucose incorporation into lipids in neurons transduced with AAV expressing A‐CREB or control (GFP) and stimulated for 48 h with Bic+4‐AP (n = 5 independent experiments). Values represent mean ± s.e.m. *P < 0.05, one‐way ANOVA followed by Tukey post hoc test.
Source data are available online for this figure.
