Fig. 1.
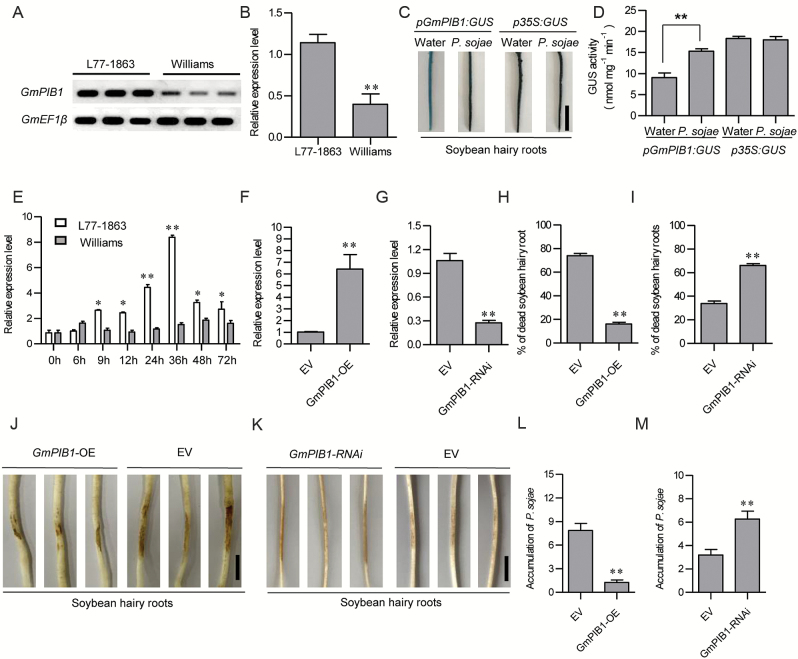
Transcriptional analysis of GmPIB1. (A) Expression patterns of GmPIB1 in susceptible soybean cultivar ‘Williams’ and resistant cultivar ‘L77-1863’, as assessed by RT-PCR. (B) Expression patterns of GmPIB1 in susceptible cultivar ‘Williams’ and resistant cultivar ‘L77-1863’, as assessed by qPCR. (C) GmPIB1 promoter-driven GUS expression in transgenic soybean hairy roots treated with P. sojae or water for 48 h. Bars, 1 cm. (D) GUS activity analysis of GmPIB1 promoter expression. GUS activity was measured using a 4-methylumbelliferyl-D-glucuronide assay. The data represent the means ±SD of three independent experiments. (E) Relative expression of GmPIB1 in soybean cultivars ‘Williams’ and ‘L77-1863’ upon P. sojae infection. The infected samples were collected at 0, 6, 9, 12, 24, 36, 48, and 72 h after inoculation with P. sojae (race 1). Relative GmPIB1 transcript levels were compared with mock-treated plants at the same time point. (F, G) qRT-PCR analysis of relative GmPIB1 expression in transgenic soybean hairy roots. Empty vector (EV) transgenic soybean hairy roots were used as controls. (H, I) Percentages of dead EV, GmPIB1-OE, and GmPIB1-RNAi roots after 5 d of P. sojae infection. Each experiment contained at least 50 roots per line, and roots were scored as dead when they were completely rotten. (J, K) Typical infection phenotypes of GmPIB1-OE, GmPIB1-RNAi, and EV soybean hairy roots after 2 d of P. sojae inoculation. Bars, 1 cm. (L, M) Accumulation of P. sojae biomass in transgenic soybean hairy roots and EV. Phytophthora sojae TEF1 (EU079791) transcript levels in infected soybean hairy roots (2 d) were plotted relative to soybean GmEF1β (NM_001248778) expression levels, as determined by qRT-PCR. The amplification of soybean GmEF1β was used as an internal control to normalize all data. The experiment was performed using three biological replicates, each with three technical replicates, and differences were statistically analysed using Student’s t-test (*P<0.05, **P<0.01). Bars indicate standard error of the mean. (This figure is available in color at JXB online.)

