Fig. 5.
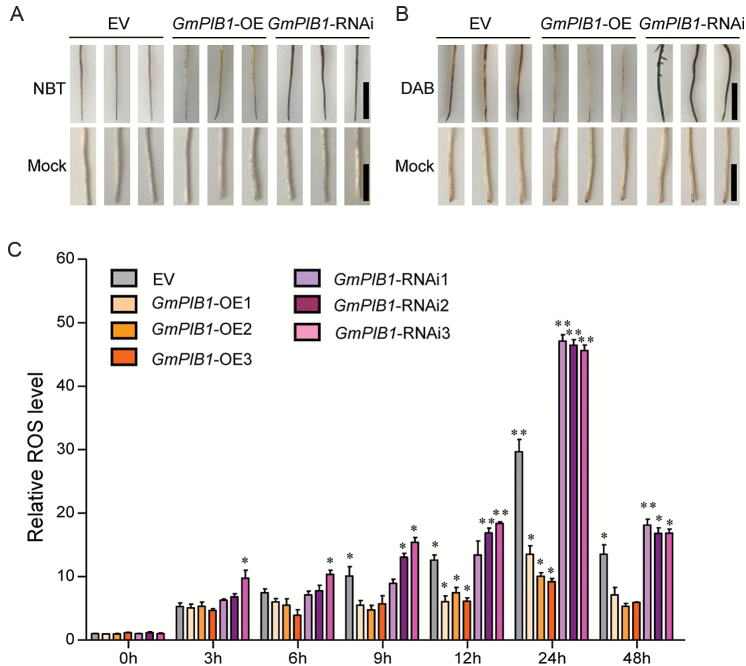
Analysis of ROS levels in GmPIB1-OE, GmPIB1-RNAi, and EV transgenic soybean hairy roots. (A) NBT staining of O2− in 20-day-old EV, GmPIB1-OE, and GmPIB1-RNAi soybean hairy roots after P. sojae zoospore treatment for 48 h. Bars, 1 cm. (B) DAB staining of H2O2 in 20-day-old EV, GmPIB1-OE, and GmPIB1-RNAi soybean hairy roots under P. sojae zoospore treatment for 48 h. Bars, 1 cm. (C) Relative ROS levels in EV, GmPIB1-OE1, GmPIB1-OE2, GmPIB1-OE3, GmPIB1-RNAi1, GmPIB1-RNAi2, and GmPIB1-RNAi3 soybean hairy roots at 0, 3, 6, 12, 24, and 48 h after P. sojae infection. Relative ROS levels were measured, i.e. the ratio of total ROS levels in soybean hairy roots treated with P. sojae zoospores versus that in hairy roots treated with equal amounts of sterile water (mock) at the same time point. Three biological replicates, each with three technical replicates, were averaged and statistically analysed using Student’s t-test (*P<0.05, **P<0.01). Bars indicate standard error of the mean. (This figure is available in color at JXB online.)

