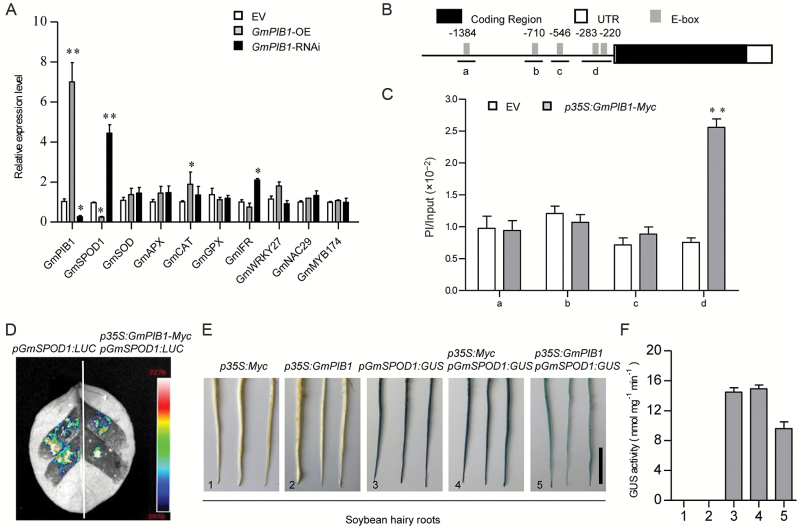
Fig. 6.
Analysis of ROS-induced gene expression in GmPIB1 transgenic and EV soybean hairy roots. (A) GmPIB1-modulated gene expression in GmPIB1-OE and GmPIB1-RNAi hairy roots compared with EV, as revealed by qRT-PCR. Soybean GmEF1β was used as an internal control to normalize all data. (B, C) ChIP analysis of GmPIB1 binding to the GmSPOD1 promoter in GmPIB1-Myc transgenic soybean hairy roots and EV. Chromatin from GmPIB1-Myc transgenic and EV hairy roots was immunoprecipitated with anti-Myc antibody and treated without antibodies. The precipitated chromatin fragments were analysed by qPCR using four primer sets amplifying four regions upstream of GmSPOD1 (GmSPOD1a, GmSPOD1b, GmSPOD1c, GmSPOD1d), as indicated. One-tenth of the input (without antibody precipitation) of chromatin was analysed and used as a control. Three biological replicates, each with three technical replicates, were averaged and statistically analysed using Student’s t-test (*P<0.05, **P<0.01). Bars indicate standard error of the mean. (D) GmPIB1 represses GmSPOD1 promoter activity in N. benthamiana leaves. Agrobacterium tumefaciens GV3101 strains harboring pGmSPOD1:LUC and p35S: GmPIB1 were transfected into N. benthamiana leaves. Luciferase imaging was performed 72 h after injection. (E) GmPIB1 represses GmSPOD1 promoter activity in soybean hairy roots. Agrobacterium rhizogenes K599 strains harboring p35S: GmPIB1, and pGmSPOD1:GUS were transfected into soybean hairy roots. Line 1, pGmSPOD1:GUS; line 2, p35:Myc; line 3, p35S: GmPIB1-Myc; line 4, p35:Myc and pGmSPOD1:GUS; line 5, p35S:GmPIB1-Myc and pGmSPOD1:GUS. (F) GUS activity analysis of GmSPOD1 promoter expression. GUS activity was measured using a 4-methylumbelliferyl-D-glucuronide assay. The x-axis numbers correspond to the numbers 1–5 in (E). The data represent the means ±SD of three independent experiments. (This figure is available in color at JXB online.)

