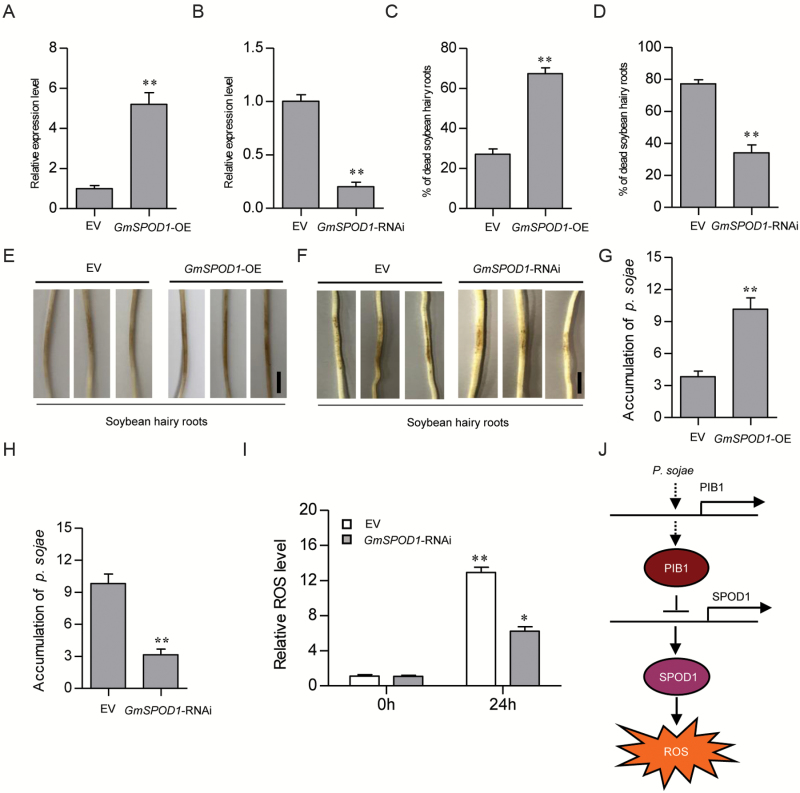
Fig. 7.
Knockdown of GmSPOD1 increases resistance to P. sojae. (A, B) qRT-PCR analysis of GmSPOD1 expression in EV, GmSPOD1-OE, and GmSPOD1-RNAi transgenic lines. (C, D) Percentage of dead hairy roots in EV, GmSPOD1-OE, and GmSPOD1-RNAi lines after P. sojae infection for 5 d. Each experiment contained at least 50 roots per line, and hairy roots were scored as dead when they were completely rotten. (E, F) Infection phenotypes of GmSPOD1-OE, GmSPOD1-RNAi, and EV soybean hairy roots after P. sojae inoculation for 2 d. (G, H) qRT-PCR analysis of relative P. sojae biomass based on the transcript level of P. sojae TEF1. (I) Relative ROS levels in EV versus GmSPOD1-RNAi lines at 0 and 24 h after P. sojae infection. Three biological replicates, each with three technical replicates, were averaged and statistically analysed using Student’s t-test (**P<0.01). Bars indicate standard error of the mean. (J) Model of the GmPIB1-mediated response to P. sojae. GmPIB1 expression is induced by P. sojae. GmPIB1 inhibits GmSPOD1 transcription by binding to the E-box element in its promoter. The suppression of GmSPOD1 expression leads to decreased intracellular ROS levels. (This figure is available in color at JXB online.)

