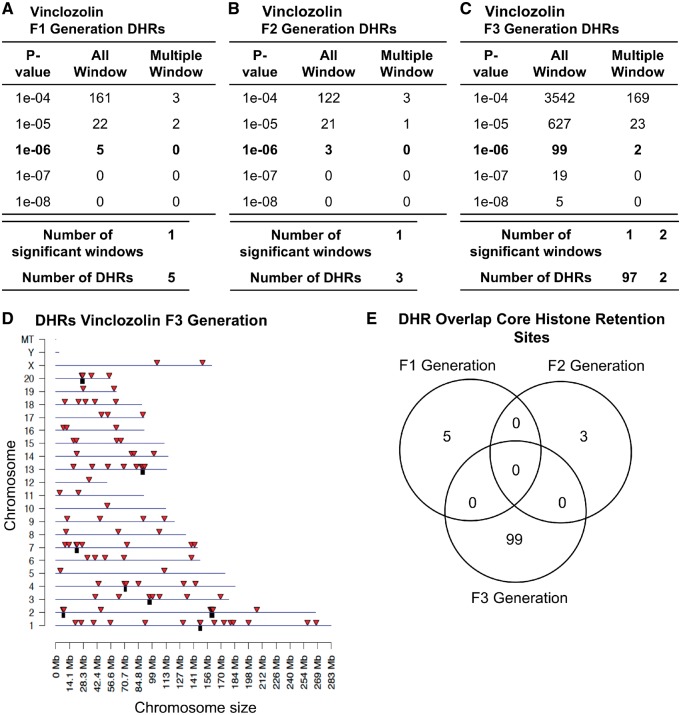
Figure 8:
vinclozolin DHRs. (A) F1 generation, (B) F2 generation, and (C) F3 generation. The number of DHRs found using different P-value cutoff thresholds. The All Window column shows all DHRs. The Multiple Window column shows the number of DHRs containing at least two significant windows. (D) Chromosomal locations of the DHRs in the F3 generation on individual chromosomes are indicated by red arrowheads and DHR clusters with black boxes. All DHRs at a P-value threshold of 1e-06 are shown. (E) The DHR overlap (P < 1e-06) for the F1, F2, and F3 generation sperm

