
Figure 5.
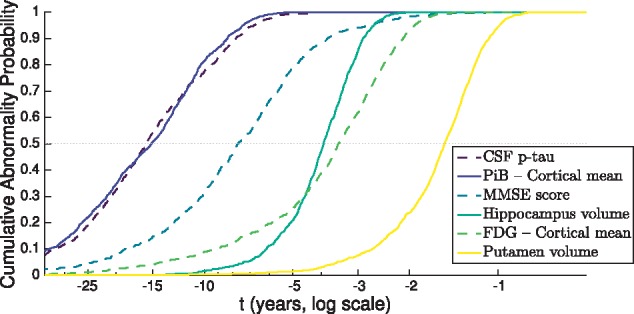
Differential equation models: selected data-driven sigmoids for dominantly-inherited Alzheimer’s disease biomarker progression. Cumulative probability of abnormality (vertical axis) is the empirical distribution of the abnormality transition time in years prior to canonical abnormality (horizontal axis) as per Fig. 4, calculated from each biomarker trajectory in Fig. 4. The horizontal axis shows years prior to canonical abnormality. The order of biomarkers in the legend follows the order in which they reach a cumulative probability of abnormality of 0.5 (horizontal dotted grey line). Green–blue–yellow colour scale (viridis) with alternating solid/dashed lines in order of cumulative abnormality probability reaching 0.5 (legend). p-tau = phosphorylated tau.