Figure 1.
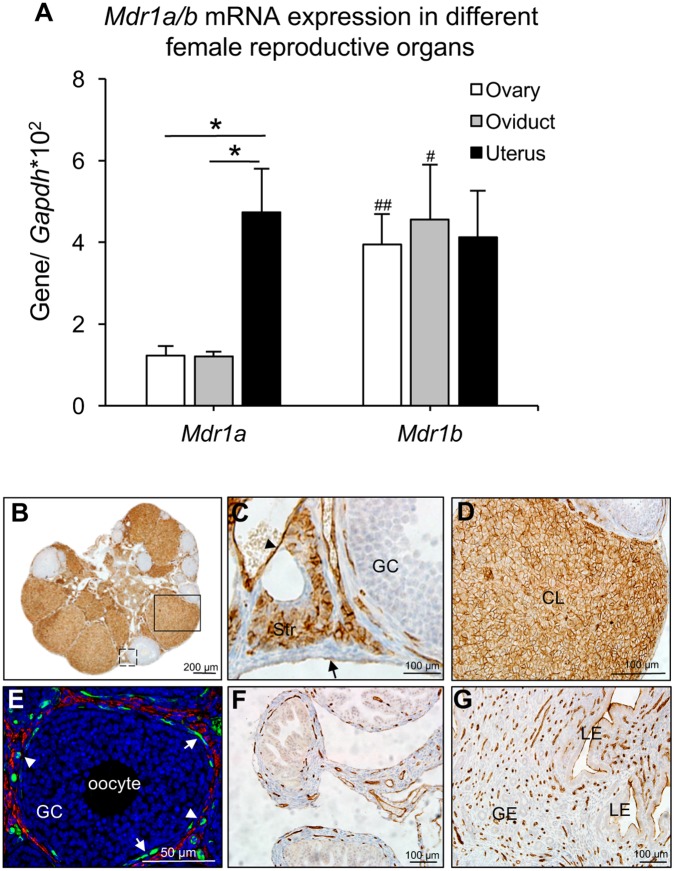
The expression of MDR1 in the female reproductive system. A, mRNA expression levels of Mdr1a and Mdr1b examined by RT-qPCR. *p < .05 for the expression of Mdr1a in the uterus compared with that in the ovary and oviduct, #p < .05 and ##p < .01 for the expression of Mdr1b compared with Mdr1a in the oviduct and ovary, respectively. Error bar: SD. Expression of MDR1 (brown staining) examined by IHC in the whole ovary (B), ovarian epithelial, stromal, and endothelial cell (C, black dash square in B), and CL (D, black square in B). E, IF staining of MDR1 (green) and α-SMA (red) in theca cell layers. IHC staining of MDR1 in the oviduct (F) and uterus (G). Arrow head and arrow in C indicated the endothelial cells of blood vessel and ovarian epithelial cells, respectively; arrow in E indicated the interna theca cells and the arrow head in E indicated the blood vessels in theca cell layers. Scale bar: 200 μm in B, 100 μm in C, D, F, G, and 50 μm in E. Str, stroma; CL, corpus luteum; GC, granulosa cells; LE, luminal epithelium; GE, glandular epithelium. Blue staining in E: DAPI (n = 4–5 female mice for each reproductive tissue and 3–5 replicates of IHC and IF staining were performed).

