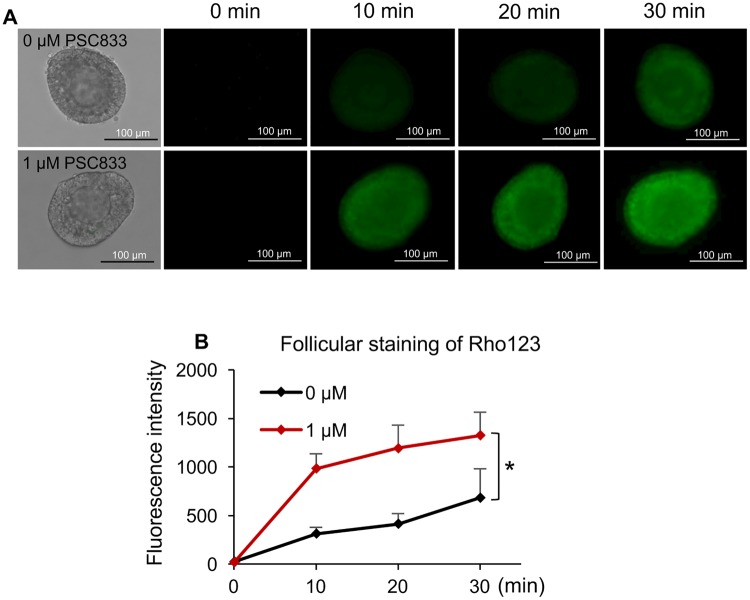
Figure 4.
The MDR1-mediated efflux activity in ovarian follicles. A, Rho123 green fluorescence of representative follicles with and without MDR1 inhibitor PSC833 treatment. Scale bar: 100 μm. B, Quantification of Rho123 green fluorescence at different time with and without MDR1 inhibitor PSC833 treatment. Error bar: SD; *p < .05 (n = 13–20 follicles for each treatment group and 3 replicates were included).

