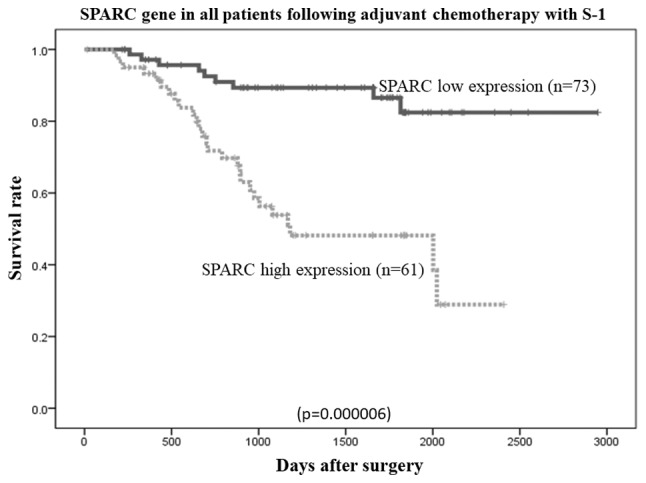
Figure 6.

Comparison of overall survival rates between low and high SPARC expression levels in patients who had following adjuvant S-1 chemotherapy (P=0.000006, as determined using the log-rank test). SPARC, secreted protein, acidic and cysteine-rich.
