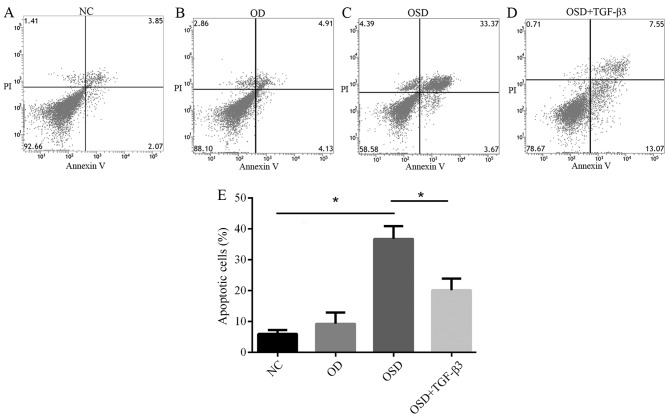
Figure 3.
Flow cytometric analysis of apoptosis in the (A) NC, (B) OD, (C) OSD and (D) OSD + TGF-β3 groups. The lower left quadrant represents normal cells, lower right quadrant represents cells in the early stages of apoptosis and the upper right quadrant represents cells in late apoptosis. (E) The number of apoptotic cells of each group in the NC, OD, OSD and OSD + TGF-β3 groups. *P<0.05. NC, negative control; OD, oxygen deprivation; OSD, oxygen and serum deprivation; TGF, transforming growth factor; PI, propidium iodide.

