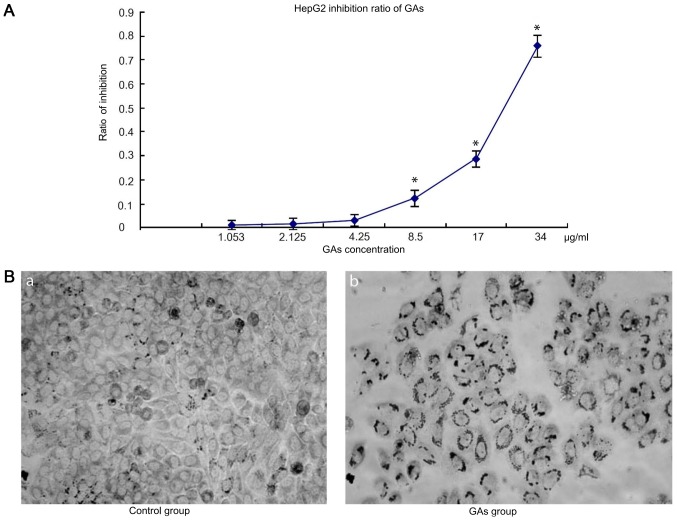
Figure 1.
GAs inhibit HepG2 cells proliferation. (A) Dose-depended curve of HepG2 cells following treatment with Gas for 24 h. The cells treated with Gas for 24 h exhibited a significantly increased level of inhibition of HepG2 cells compared with the control group (*P<0.05 vs. control group). (B) Images of HepG2 cells treated with GAs at 24 h captured by light microscopy (magnification, ×200). (Ba) control group and (Bb) HepG2 cells treated with GAs. The cells treated with Gas were decreased in size compared with those in the control group. GAs, ginkgolic acids (the P-value of each two groups depicted in Table I).

