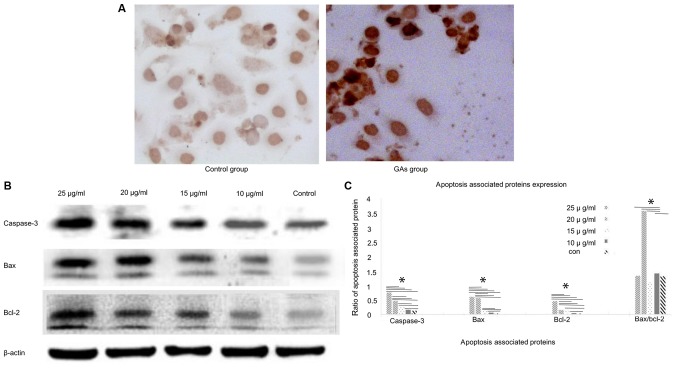
Figure 2.
Apoptosis and its associated proteins expression levels in HepG2 cells at 24 h following treatment with GAs. (A) Apoptosis of GAs-treated cells, as measured by terminal deoxynucleotidyl-transferase-mediated dUTP nick-end labeling staining. The proportion of apoptotic GA-treated cells was markedly higher than the control-treated cells. (B) The expression of apoptosis-associated proteins in HepG2 cells was detected by western blot analysis. The expression of caspase-3, Bax, and Bcl-2 in the GA-treated groups (various concentrations) was increased compared with that in the control group, and the caspase-3, Bax and Bcl-2 protein expression levels increased as the concentration of Gas increased. The Bax/Bcl-2 ratio reached its peak in the20 µg/ml group, which was close to the median lethal dose of GAs. (C) Quantification of the apoptosis-associated proteins bands in (B) (*P<0.05). GAs, ginkgolic acids; Bcl-2, B-cell lymphoma 2; Bax, Bcl-2-associated X protein.

