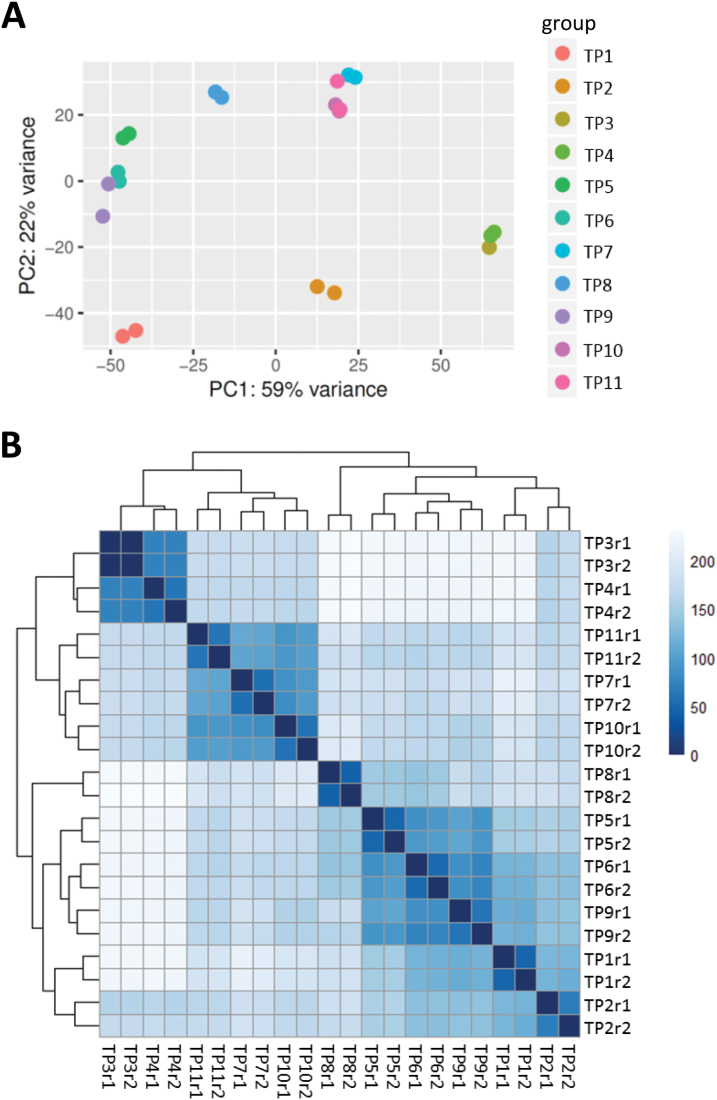
Fig. 3.
Clustering of gene expression patterns between different samples. (A) Clustering and relationships between conditions by principal component analysis (PCA) using a dimensionality reduction strategy in cummeRbund (http://compbio.mit.edu/cummeRbund/). (B) Distance matrix among all samples using read counts normalized using the rlog function of DESeq2 (doi:10.18129/B9.bioc.DESeq2). The distance matrix shows that time-points TP1, TP2, TP5, TP6, TP8, and TP9 grouped together, and that TP3, TP4, TP7, TP10, and TP11 grouped together. See Fig. 1 for the temperature regime.

