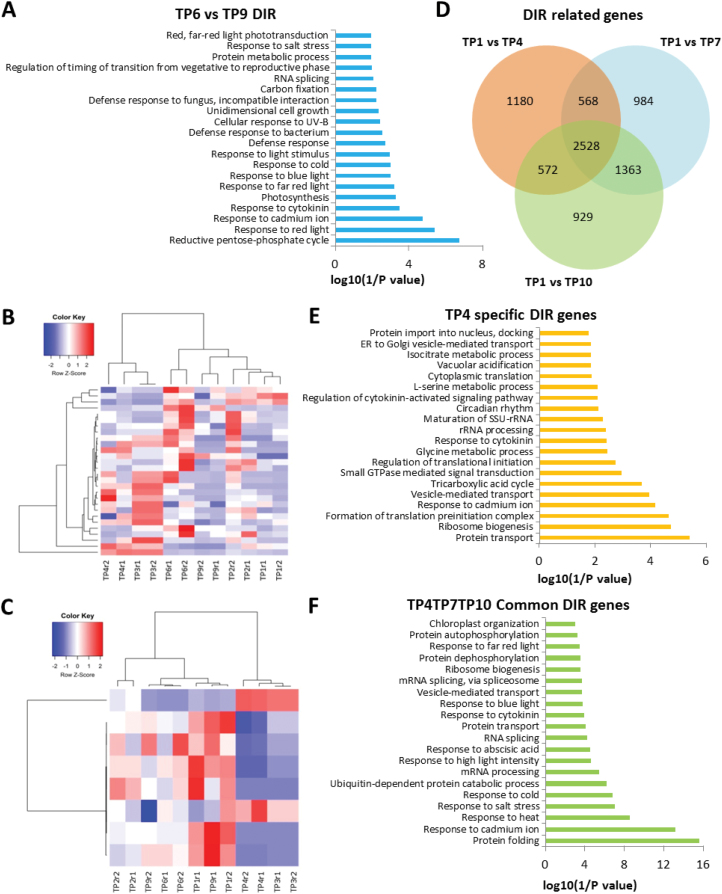
Fig. 6.
Different expressed intron retention (IR) events and related genes at various time-points (TPs). (A) Gene ontology (GO) analysis of differentially expressed IR genes for TP6 versus TP9. (B, C) Clustering of expression profiles of the genes defined as heat-memory alternative splicing events: (B) 28 genes with more retained introns in TP6, (C) eight genes with more retained introns in TP9. (D) Venn diagram showing a comparison of differential IR (DIR)-related genes between samples after heat priming (TP4) and heat shock (TP7 and TP10). (E) Functional categorization (biological process) of DIR-related genes in the heat-priming sample only (TP4). (F) Functional categorization (biological process) of DIR-related genes in all three samples (TP4, TP7, and TP10). The top 20 enriched pathways are shown. See Fig. 1 for the temperature regime.

