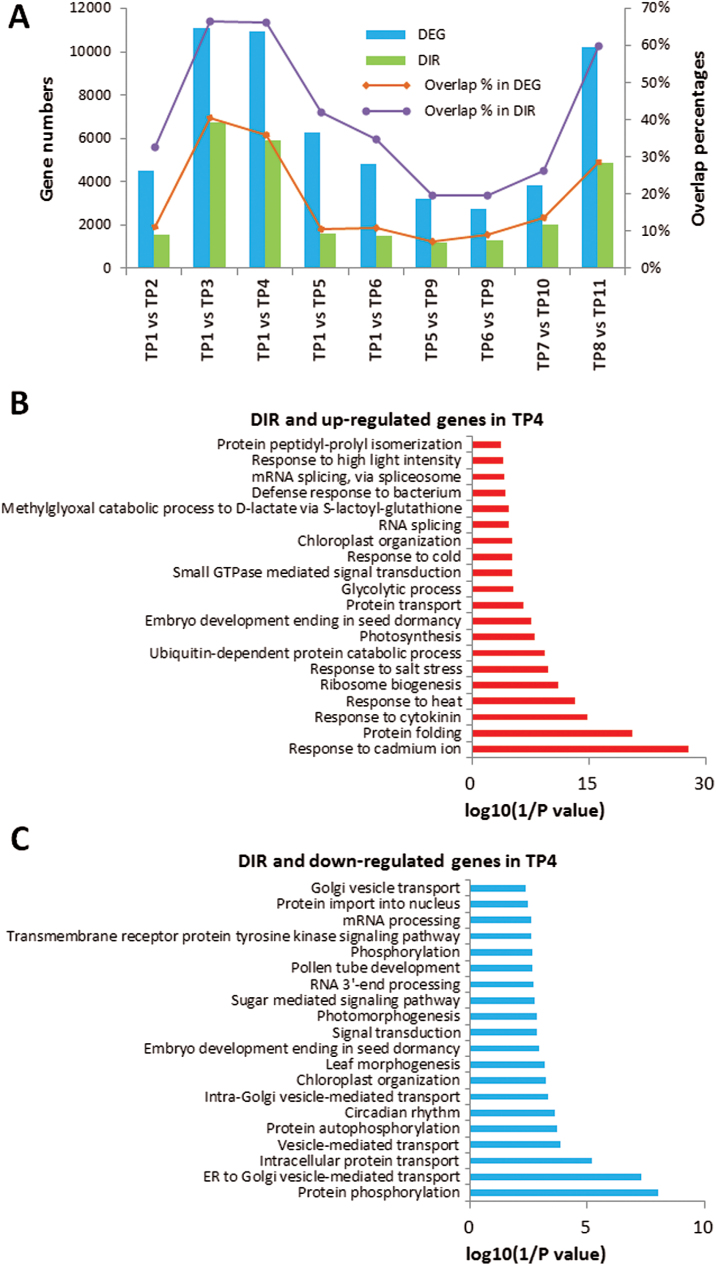
Fig. 7.
Differentially expressed genes (DEGs) and differential intron retention (DIR) genes between various time-points. (A) The number of DEGs, the number of DIRs, and the percentages of overlapping genes in DEGs and DIRs found in different comparisons of time-points (TPs). (B) Gene ontology (GO) analysis of up-regulated and with DIR genes between TP4 and TP1. (C) GO analysis of down-regulated and with DIR genes between TP4 and TP1. See Fig. 1 for the temperature regime. (This figure is available in colour at JXB online.)

