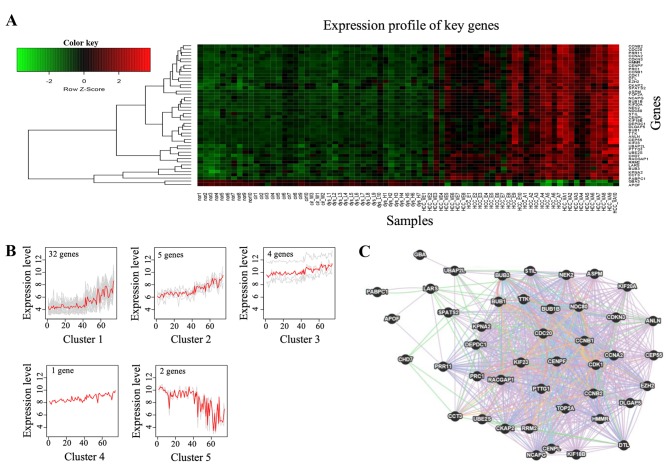
Figure 2.
Expression patterns of the 44 key genes. (A) Heatmap shows the gradual change in the expression level of key genes between the normal stage and hepatocellular carcinoma. (B) The 44 key genes are grouped into five clusters by self-organizing tree algorithm, and the genes show gradual expression trends along with the disease stages (|r|>0.8, P<0.01). (C) Interaction network of the 44 genes, based on the GeneMANIA online tool.

