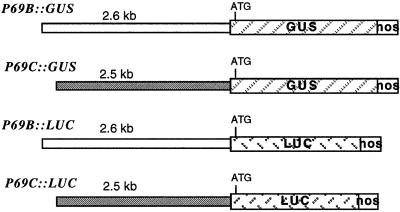
Figure 1.
Schematic representation of the different P69::GUS and P69::LUC gene fusions. The diagonally striped boxes represent the GUS or LUC genes. The white box at the right represents the 3′-region of the nopaline synthase gene. The length of each of the promoter regions is shown above each construct in kilobase pairs. The ATG codon represents the first translation initiation codon that resides in the reporter gene.

