Figure 2.

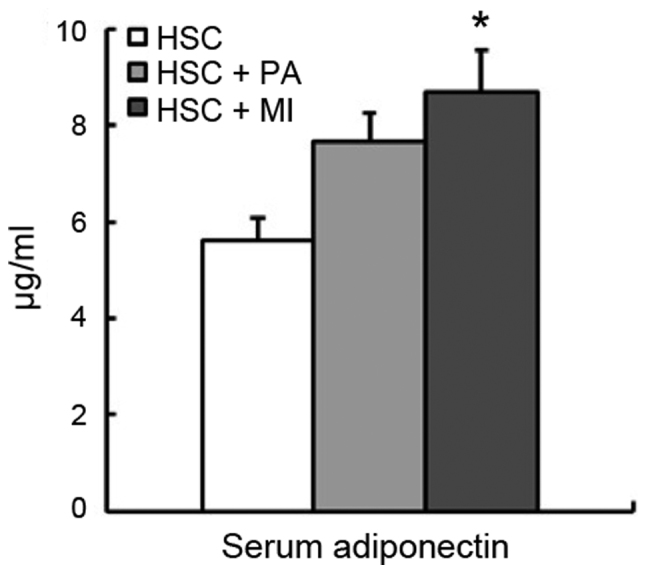
Serum adiponectin in rats fed an HSC diet with or without 1.02% sodium PA or 0.2% MI. Each bar represents mean ± standard error of the mean values (n=6). *P<0.05 vs. HSC group. HSC, high-sucrose; PA, sodium phytate; MI, myo-inositol.

Serum adiponectin in rats fed an HSC diet with or without 1.02% sodium PA or 0.2% MI. Each bar represents mean ± standard error of the mean values (n=6). *P<0.05 vs. HSC group. HSC, high-sucrose; PA, sodium phytate; MI, myo-inositol.