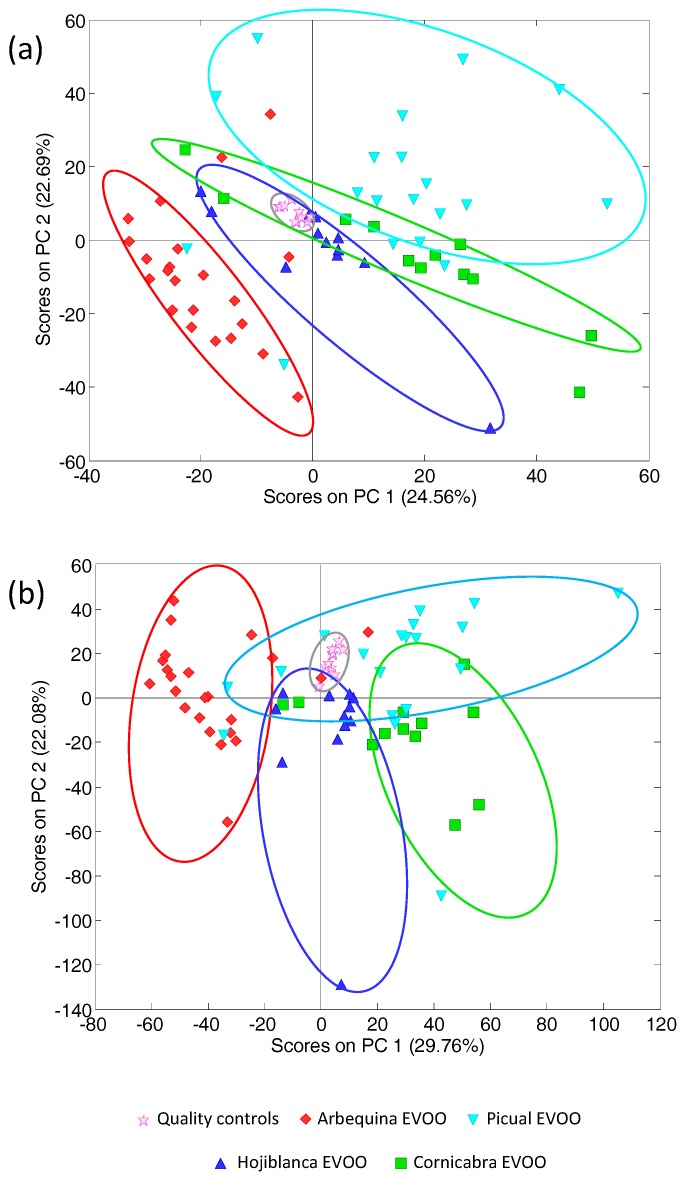
Figure 3.
Principal component analysis (PCA) results (scatter score plot of PC1 vs. PC2) in the analysis of 66 EVOOs obtained from monovarietal olive cultivars by employing as data: (a) HPLC-UV chromatographic profile segments of 5–8 min, 13–21 min, and 23–26 min simultaneously (registered at 280 nm); and (b) a combination of the HPLC-UV chromatographic profile segments from 13 to 32 min obtained at 257, 280, and 316 nm, simultaneously.

