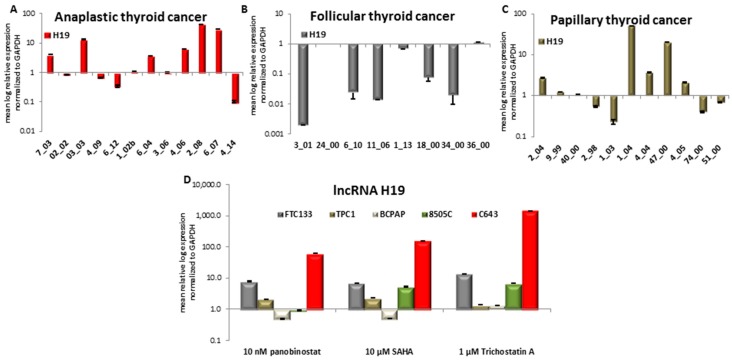
Figure 8.
Expression of lncRNA H19 in ATC, FTC, PTC, and thyroid cancer cells that were treated with deacetylase inhibitors. RT-qPCR analysis of TTF1 transcript level in ATC (A), FTC (B), PTC (C) and FTC133, TPC1, BCPAP, 8505C and C643 cells (D) after 48 h of treatment with 10 nM panobinostat, 10 µM SAHA and 1 µM Trichostatin A. mRNA expression was normalized to GAPDH. Results are expressed relative to untreated controls set at 1.0. Shown are means ± SEM of three independent experiments performed in triplicates.

