Figure 2.
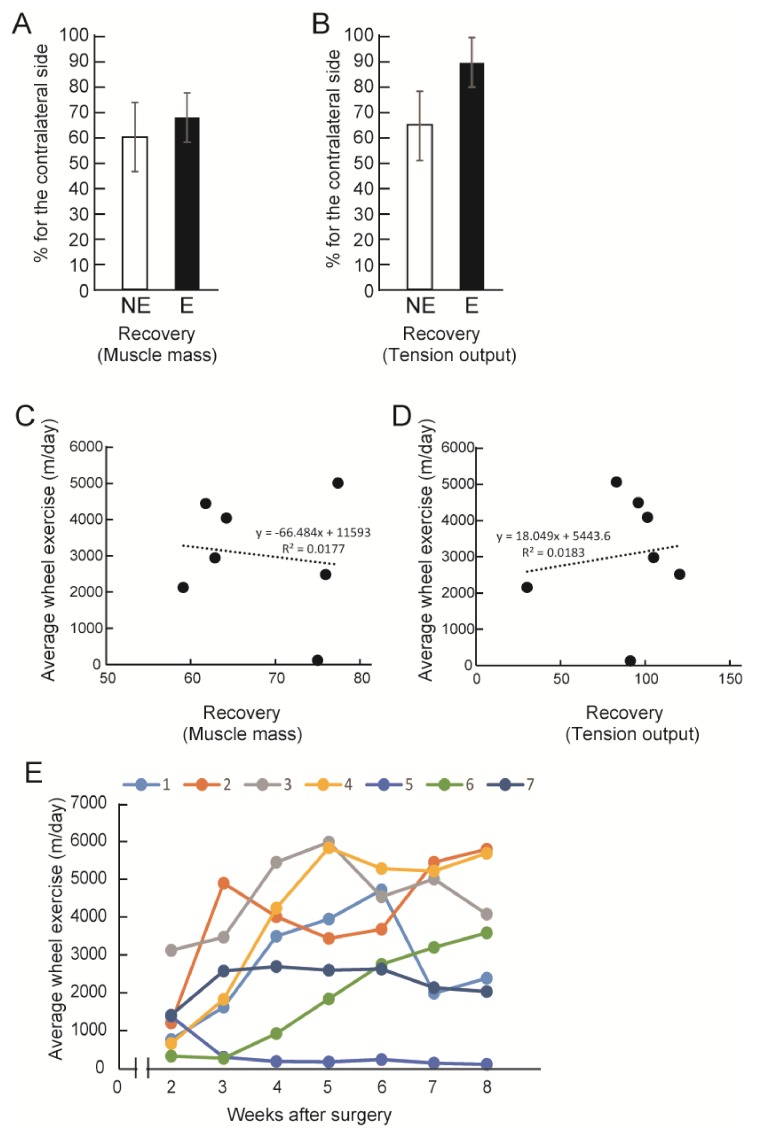
Recovery of downstream muscle mass and tension output, and individual exercise statistics. (A) Recovery of total muscle mass (gastrocnemius (GAS) + plantaris (PLA) + combined soleus (SOL)); (B) Recovery of tension output of the three muscles. Both markers are calculated based on the contralateral side. The E group consistently shows better recovery than the NE group; (C) Relationship between average wheel exercise (m/day) and muscle mass recovery; (D) Relationship between average wheel exercise (m/day) and muscle tension recovery; (C,D) shows individual plots, and there are no correlations; (E) Individual shift of exercise volume during recovery term.

