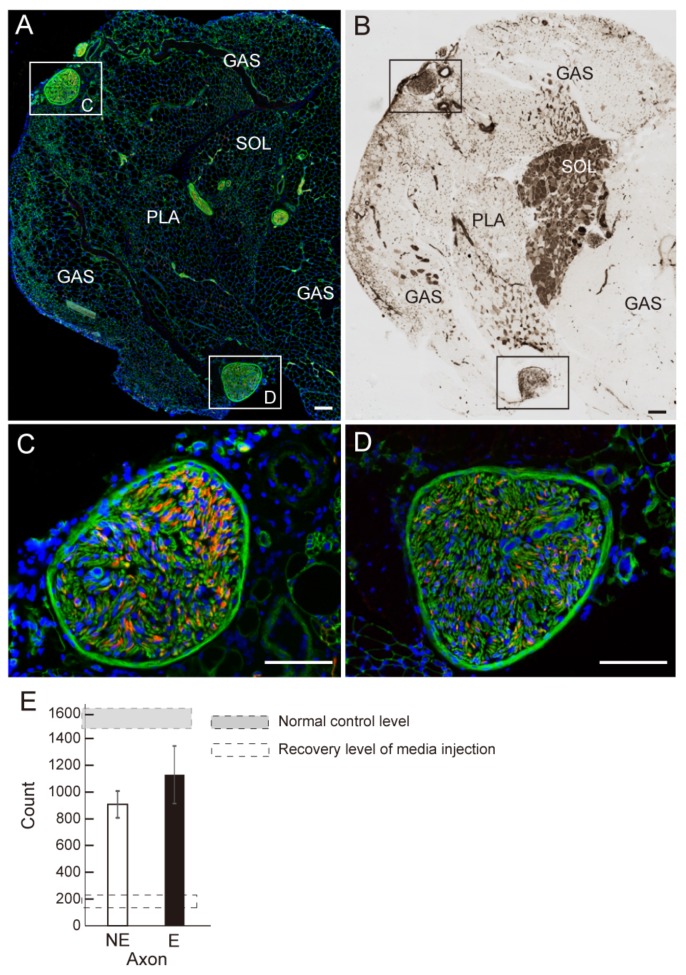
Figure 3.
Detection and analysis of tibial nerve branches in the downstream muscles of E-group. (A) A typical histological section of the NE group showing the combined heads of gastrocnemius (GAS), planters (PLA) and Soleus (SOL) muscles, stained with N200 (red) and laminin (green); (B) ATPase (pH 4.3) staining of the same histological section. Location of the three muscles (GAS, PLA and SOL) is clear; (C,D) Panels (C,D) show higher magnification of tibial nerve branches derived from the portions in the squares in panel (A,B) stained with N200 (red) and laminin (green). Blue staining in (A,C,D) is nuclear staining of DAPI. Bars in A–D = 100 μm; (E) Comparison of the number of axons in the tibial nerve branches. In this analysis, the E group showed higher recovery than NE. However, the morphological characteristics of NE and E group were wholly similar. Gray dotted square shows the mean number of axons in the same portion of a normal control animals based on our pooled data. Open dotted square shows the recovery level in for conduit + non-cell media injection derived from our pooled data.

