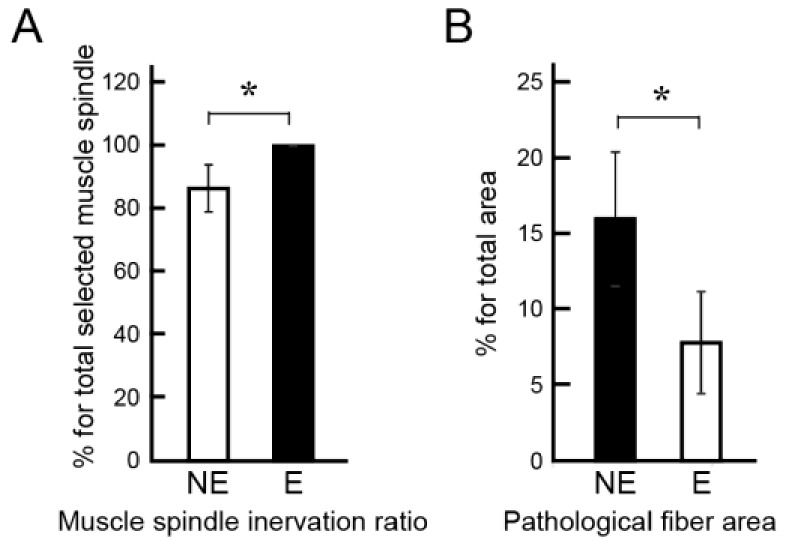
Figure 5.
Comparison of the innervation of muscle spindle and pathological fiber area. (A) Muscle spindle innervation ratio determined by 23 spindles. The E group showed 100% innervation, which is significantly higher than NE group (87%); (B) Existence of pathological muscle fiber area account for a percentage of total area of cross-section. The E group showed significantly lower existence of pathological fibers. * p < 0.05.

