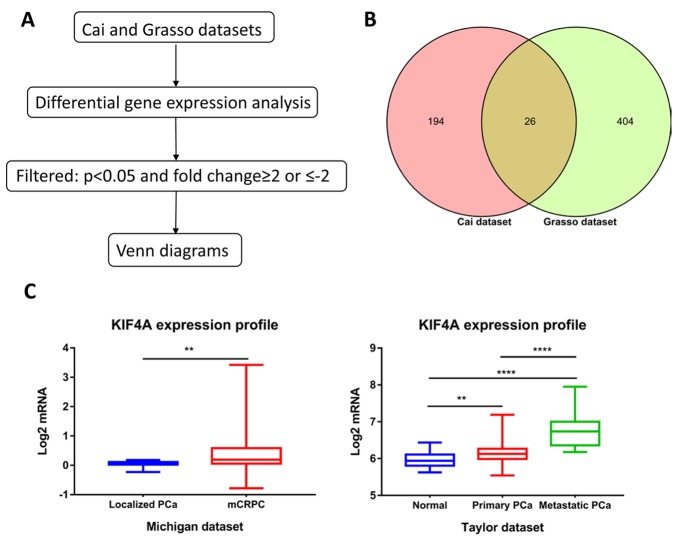
Figure 1.
Identification commonly upregulated genes. (A) Flowchart for identifying dysregulated genes through DGEA. (B) Venn diagram depicting the commonly upregulated genes in Cai and Grasso datasets. (C) Upregulated genes expression profiles in Michigan and Taylor datasets. (**P<0.001; ****P<0.0001). KIF, kinesin super-family protein; PCa, prostate cancer;

