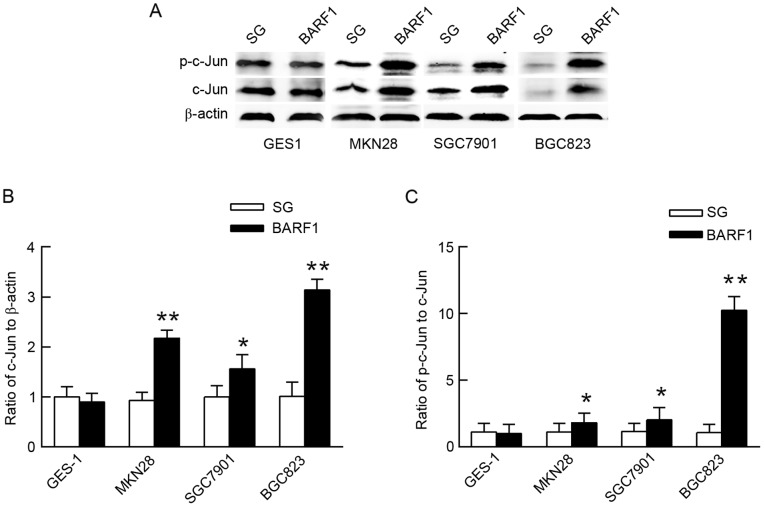
Figure 1.
The expression and phosphorylation levels of the c-Jun protein in GEC-BARF1 cells. (A) Western blotting and quantitative analysis of (B) c-Jun protein expression and (C) phosphorylation in GEC-BARF1 cells compared with GEC-SG cells. Data were expressed as the mean ± standard deviation from three independent experiments. *P<0.05, **P<0.01 vs. GEC-SG.

