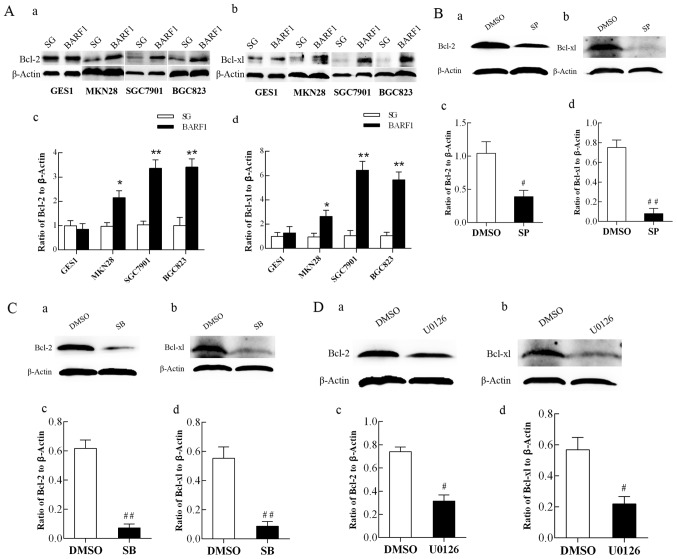
Figure 3.
Analysis of Bcl-2 and Bcl-xL protein expression in GEC-BARF1 cells. Western blotting of (A-a) Bcl-2 and (A-b) Bcl-xL expression, and quantitative analysis of (A-c) Bcl-2 and (A-d) Bcl-xL expression in GEC-BARF1 cells compared with GEC-SG cells. (B-a, B-b, C-a, C-b, D-a and D-b) Western blotting and quantitative analysis of (B-c, C-c and D-c) Bcl-2 and (B-d, C-d and D-d) Bcl-xL protein expression levels in SGC-BARF1 treated with SP600125, SB203580 and U0126 compared with DMSO, respectively. Data were expressed as the mean ± standard deviation from three independent experiments. *P<0.05, **P<0.01 vs. GEC-SG. #P<0.05, ##P<0.01 vs. DMSO control. DMSO, dimethyl sulfoxide; Bcl, B-cell lymphoma.

