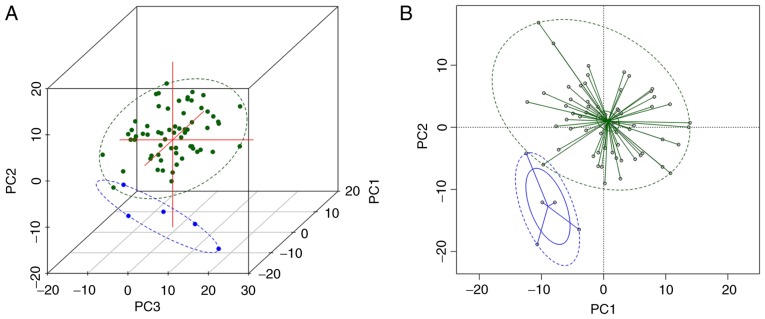
Figure 2.
(A) Three-dimensional graph of the first three PCs of HB, WBC and PLT by PCA; (B) graph of the first two PCs of HB, WBC and PLT by PCA. Green points represent stable ET patients, blue points represent patients with progressive ET. Green and blue ellipses are the 95% confidence ellipses of patients with stable ET and progressive ET, respectively. The two statuses are clearly distinguished on the graphs and are significantly different (P=0.001). PCA, principal component analysis; HB, hemoglobin; WBC, white blood cells; PLT, platelets; ET, essential thrombocythemia.

