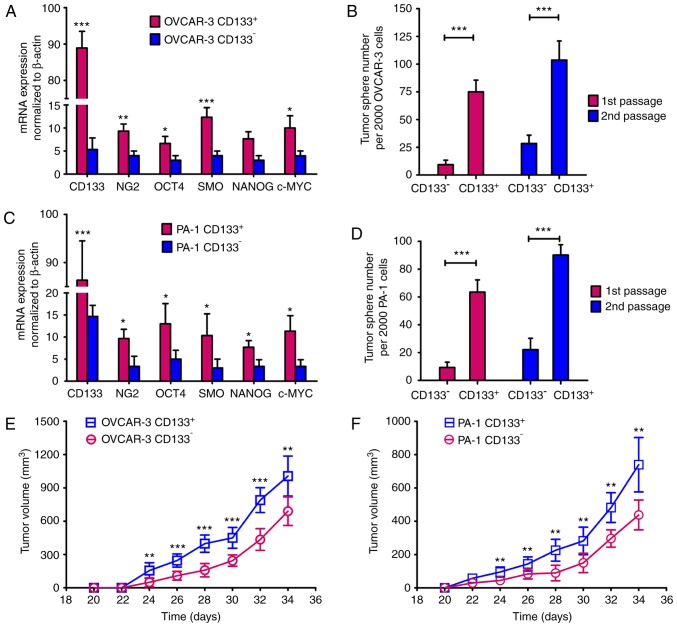
Figure 1.
CD133+ ovarian cancer cells have ovarian cancer stem cell properties. (A) The mRNA expression levels in OVCAR-3 ovarian cancer cells were analyzed by RT-qPCR (B) CD133+ OVCAR-3 ovarian cancer cells generated more tumor spheres than CD133− OVCAR-3 ovarian cancer cells. (C) The mRNA expression levels in PA-1 ovarian cancer cells were analyzed by RT-qPCR (D) CD133+ PA-1 ovarian cancer cells generated more tumor spheres than CD133− PA-1 ovarian cancer cells. Data are expressed as the mean ± SD (n=3). Tumor growth curves for (E) OVCAR-3 and (F) PA-1 ovarian cancer cells. CD133+ or CD133− ovarian cancer cells (5×10⁵) were inoculated in BALB/c nude mice. The data are expressed as the mean ± SD (n=6). All data were analyzed using independent samples Student's t-tests. *P<0.05, **P<0.01 and ***P<0.001 vs. CD133−. CD, cluster of differentiation; RT-qPCR, reverse transcription-quantitative polymerase chain reaction; SD, standard deviation.

