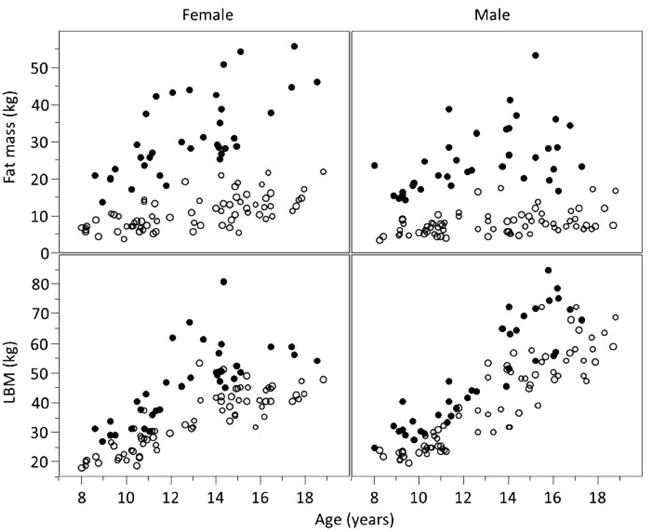
Figure 2.

Scatter plot of fat mass and lean body mass (LBM) vs age. Open circles represent individual with a normal body mass index (BMI); closed circles represent individual with a high BMI. The high-BMI groups had substantially greater fat mass than normal-BMI. Lean body mass tended to be greater in the high-BMI, but to a lesser degree than fat mass.
