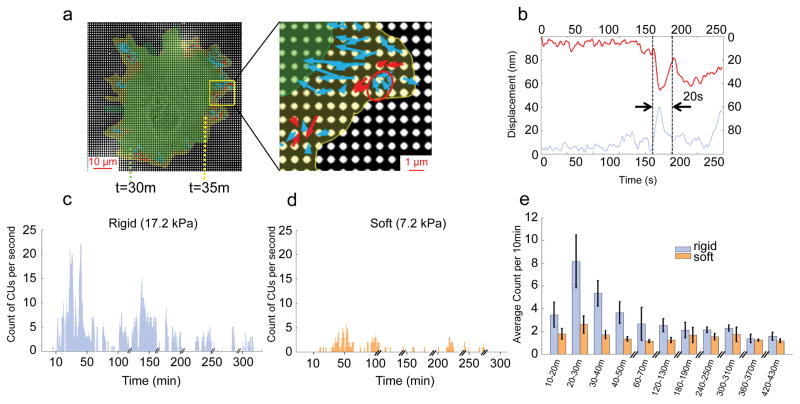
Figure 1.
Rigidity sensing activity measured by local CUs number. a, Actual CUs observed at the outward extending edge of a cell spreading on FN-coated 17.2 kPa pillars. Arrows represent pillar movement: red, detected CUs; blue, non-CUs. The red circle marks an example of a correctly identified CU. Cell edges marked in green and yellow correspond to time points 30 and 35 minutes respectively. b, Displacement vs. time of two 0.5 μm pillars (red and blue curve) that composed a CU (circled in a). The dotted lines mark the beginning and end time point of the CU. c,d, Measurement of CUs per entire cell per second for rigid (c) and soft (d) pillars. Cells were plated on FN-coated pillar substrate in media lacking serum for over 7 h. e, Average number of CUs per 10 min for cells on two pillar substrates of different stiffness in media lacking serum. n>10 cells per condition. n>5 independent experiments. Error bars show standard error of the mean.

