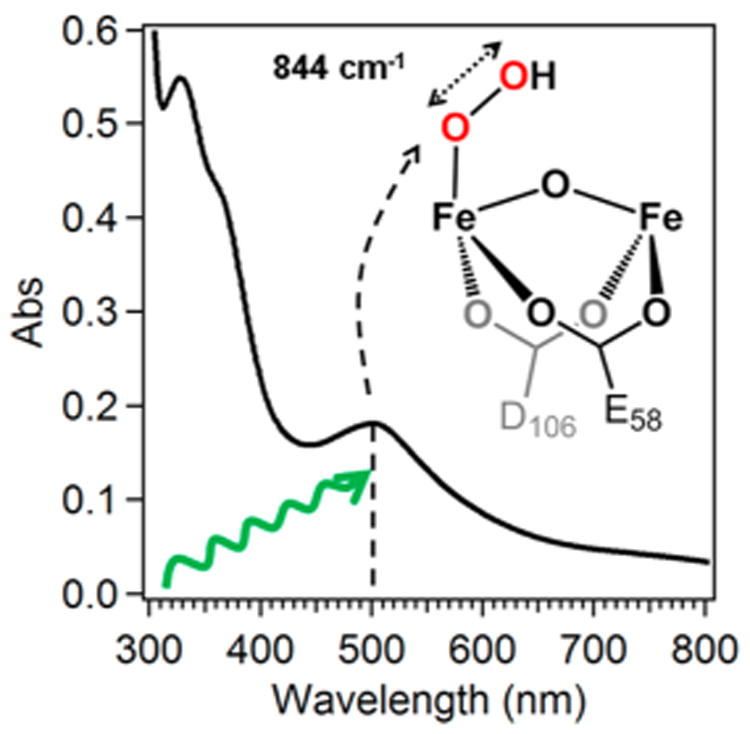
Figure 5.

Simplified diagram for resonance Raman data collection of peroxodiferric intermediates. The absorption spectrum is of oxyHr (prepared by Dr. Anna Komor) with a peroxo-to–FeIII LMCT transition at ∼500 nm, marked by the vertical dashed line. Excitation by a laser with similar wavelength (green curved line) into the LMCT band results in the observation of resonance enhanced vibrations, such as the O–O stretch at 844 cm−1.
