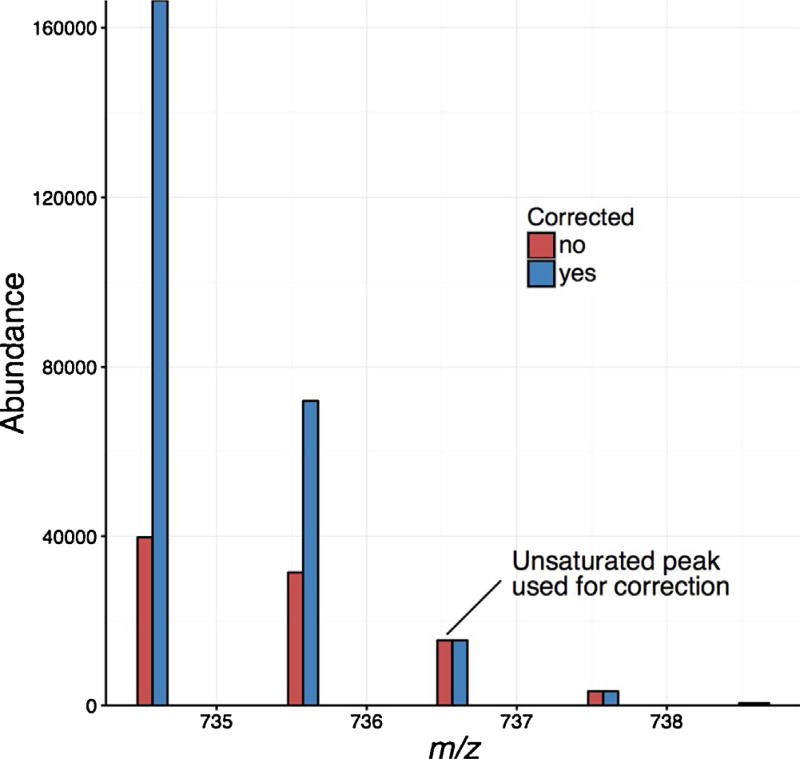
Fig. 5.
The lipid isotopic profile for PC(16:0/16:0) before (red) and after (blue) saturation correction. The theoretical isotopic distribution for PC(16:0/16:0) was computed with www.chemcalc.org, which illustrated that the (M + 2) peak was the first unsaturated peak in this profile, thus it was used for correction. (For interpretation of the references to colour in this figure legend, the reader is referred to the web version of this article.)

