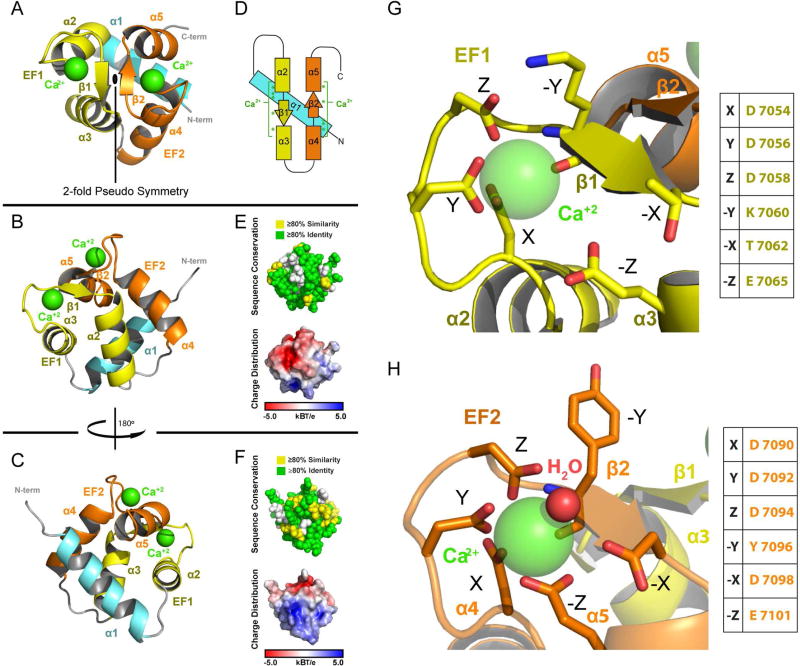
Figure 2. EF1-EF2 Domain Structure.
(A–C) Structure of the EF1-EF2 domain in different orientations. Following the N-terminal α-helix (cyan) are the EF1 (yellow) and EF2 (orange) helix-turn-helix motifs. Calcium atoms are shown in green. (D) Secondary structure topology of the EF1-EF2 domain showing the location of residues that coordinate calcium (green asterisks). (E,F) The EF1-EF2 domain illustrating cross-species conservation as delineated in Figure 1C (above, spherical representation) and displaying electrostatic surface potential (below, surface representation). Domain orientation in (E) and (F) correspond to the orientation in (B) and (C) respectively. (G, H) Zoom views of the EF1 and EF2 calcium binding sites. Canonical EF-Hand residues are indicated. See also Figure S2.

