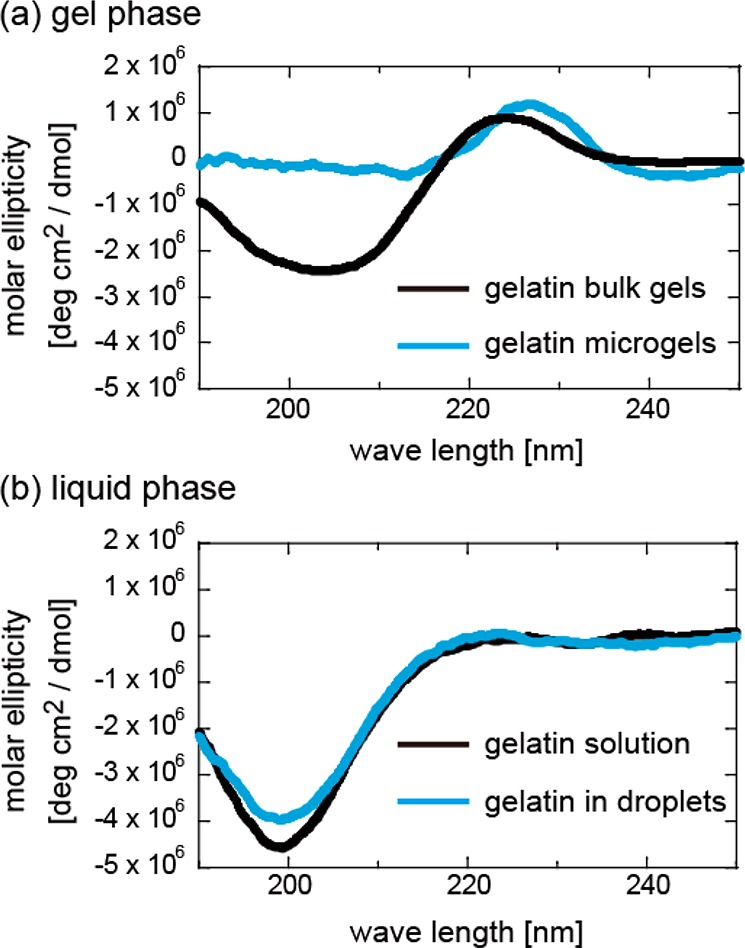
Figure 5.

(a) CD spectra of a cut piece of bulk gels (black) and collected microgels (blue) of gelatin 5.0 wt %. Both the samples were immersed in a 3.0 wt % PEG solution. (b) The CD spectra of the gelatin solution in bulk (black) and lipid droplets (blue).
