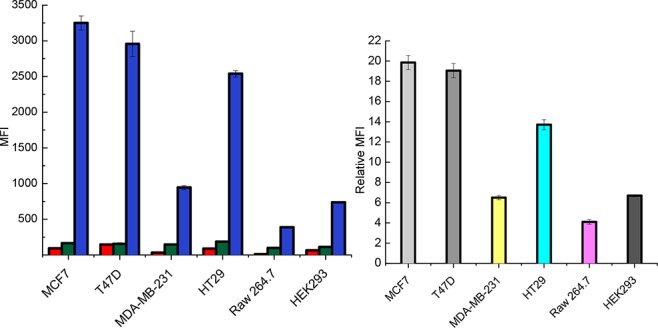
Figure 4.

Flow cytometry analysis of the relative expression levels of sialyl-T across various cancer cell lines. Cells were untreated (red) or chemoenzymatically labeled in the absence (green) or presence (blue) of ST6GalNAc-IV. Quantification of the mean fluorescence intensity (MFI) relative to cells labeled in the absence of ST6GalNAc-IV is shown on the right. Error bars represent data from triplicate experiments.
