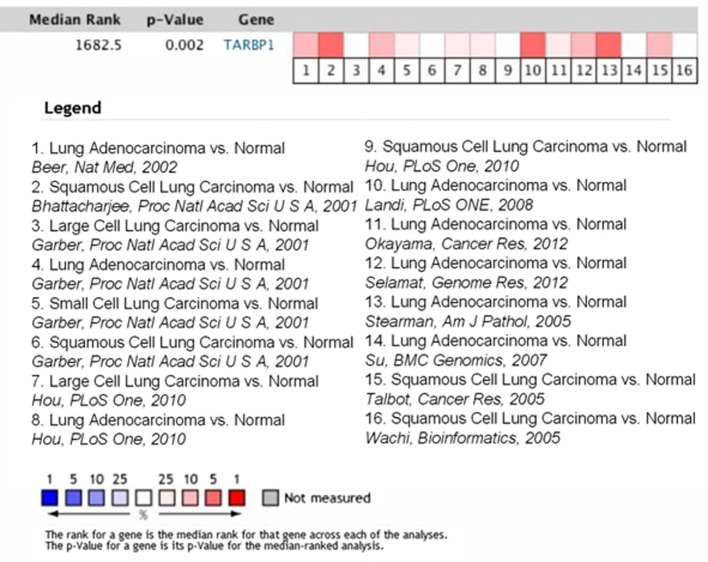
Figure 1.
TARBP1 expression is upregulated in human lung cancer samples in the Oncomine database. Oncomine heat map of TARBP1 gene expression in clinical lung cancer samples compared with the normal lung tissues (www.oncomine.org). Sixteen sets of published mRNA expression data were chosen in this study. Significantly upregulated TARBP1 in cancer tissue samples compared with normal controls (>2-fold) were first selected. In the meta-analysis, TARBP1 expression was identified to be significantly higher in lung cancer than in the corresponding normal tissues with a median rank of 1862.5 and a P-value of 0.002. The degree of colour correlates to the gene rank percentile of the highest ranking analyses. The red colour represents overexpression of TARBP1 genes, and the blue colour represents underexpression of TARBP1 genes.

