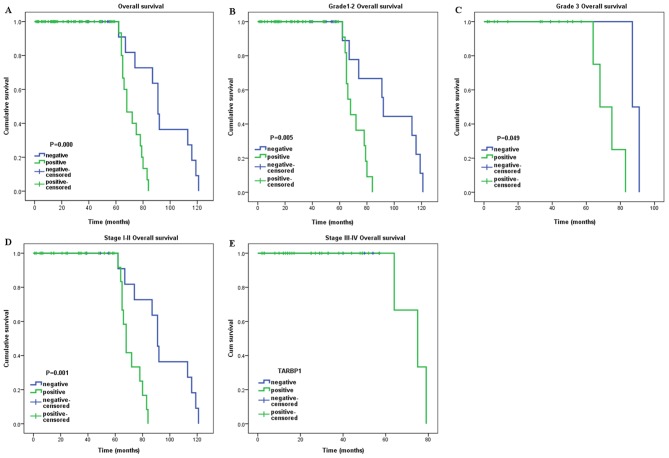
Figure 5.
Kaplan-Meier curves with univariate analysis (log-rank). (A) OS rates for cases with TARBP1 positive expression vs. those with TARBP1 negative expression in all patients. (B) OS rate for grade 1–2 cases with TARBP1 positive expression vs. those with TARBP1 negative expression. (C) OS rate for grade 3 cases with TARBP1 positive expression vs. those with TARBP1 negative expression. (D) OS rate for early clinical stage cases (stage I/II) with TARBP1 positive expression vs. those with TARBP1 negative expression. (E) OS rate for late stage cases (stage III/IV) with TARBP1 positive expression vs. those with TARBP1 negative expression.

