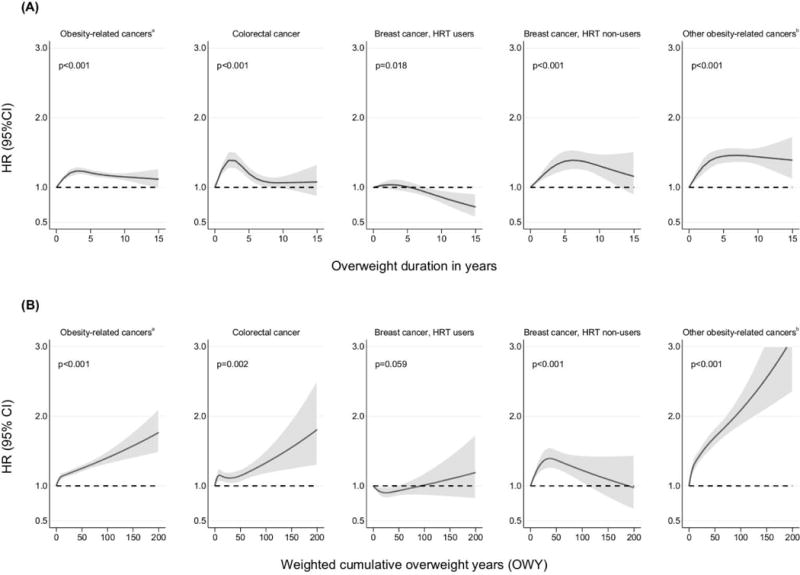
Fig 3.

Hazard ratios (HR) and their 95% confidence intervals (95%CI) for the association between (A) overweight (BMI≥25) duration, (B) weighted cumulative overweight years (OWY) and cancer risk, men and women combined
abreast, colorectum, pancreas, kidney, gallbladder, endometrium, ovary, liver, lower oesophagus, cardia stomach
bpancreas, kidney, gallbladder, endometrium, ovary, liver, lower oesophagus, cardia stomach
The figure shows a 3-knot spline of the relation between overweight duration and cancer risk, allowing for non-linear effects and adjusted for sex, study, smoking status and physical activity (Model 2). Restricted cubic splines very fitted with knots at 0, 1, 5 and 10 years for overweight duration and at 0, 1, 13 and 65 for OWY. P-values are for non-linearity.
