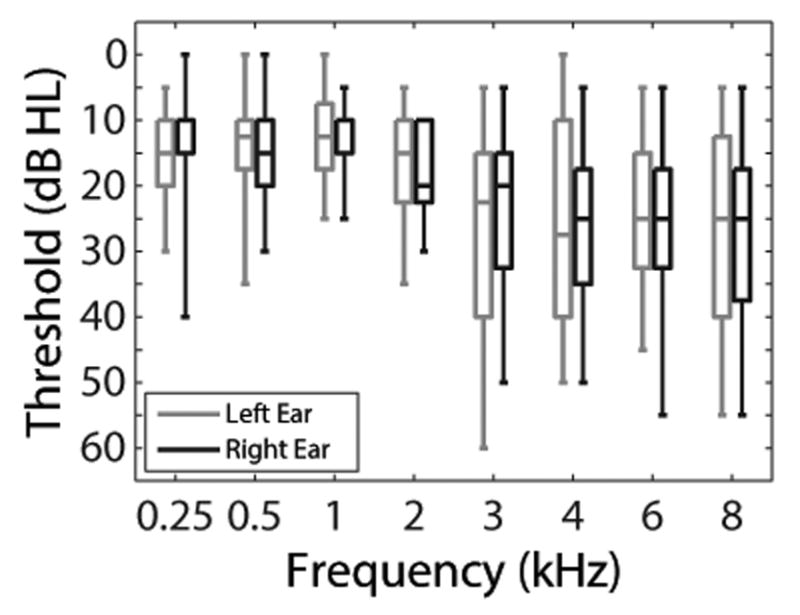
Fig. 1.

Box plots of audiometric thresholds. The bottom and top of each box represents the first and third quartiles, respectively. The horizontal line within each box represents the median. The lower and upper vertical lines extend to the minimum and maximum values, respectively.
