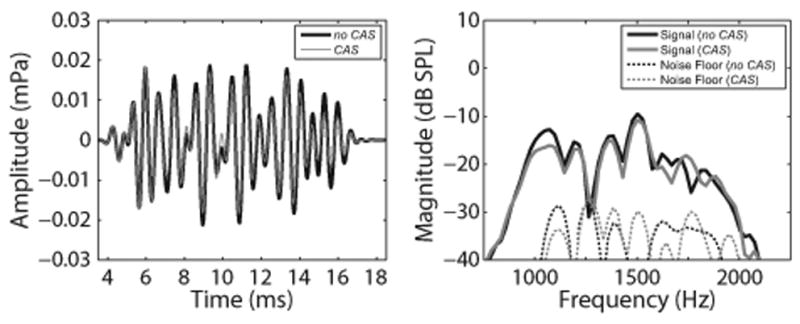
Fig. 3.

Example of mean TEOAE waveforms (left panel) and spectra (right panel) for one representative subject. TEOAE amplitudes and magnitudes decreased in the presence of contralateral noise, as expected. In both panels, black and gray solid lines represent responses in the no CAS and CAS conditions, respectively. In the right panel, the thin black and gray dotted lines represent the recording noise floors in the no CAS and CAS conditions, respectively. TEOAE indicates transient-evoked otoacoustic emission; CAS indicates contralateral acoustic stimulation; mPa indicates millipascal.
