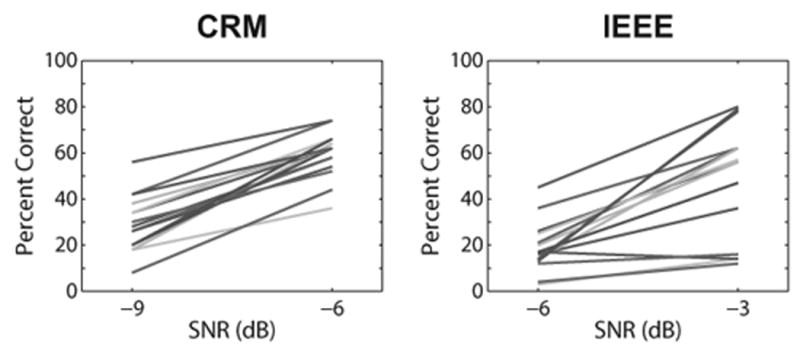
Fig. 4.

Changes in speech perception scores across SNRs for the CRM (left panel) and IEEE (right panel) tests. Each line represents performance for a different individual subject. The difference in percent correct at each SNR was divided by 3 to yield the slopes of the individual psychometric functions. SNR indicates signal-to-noise ratio; CRM indicates coordinate response measure; IEEE indicates Institute of Electrical and Electronics Engineers.
