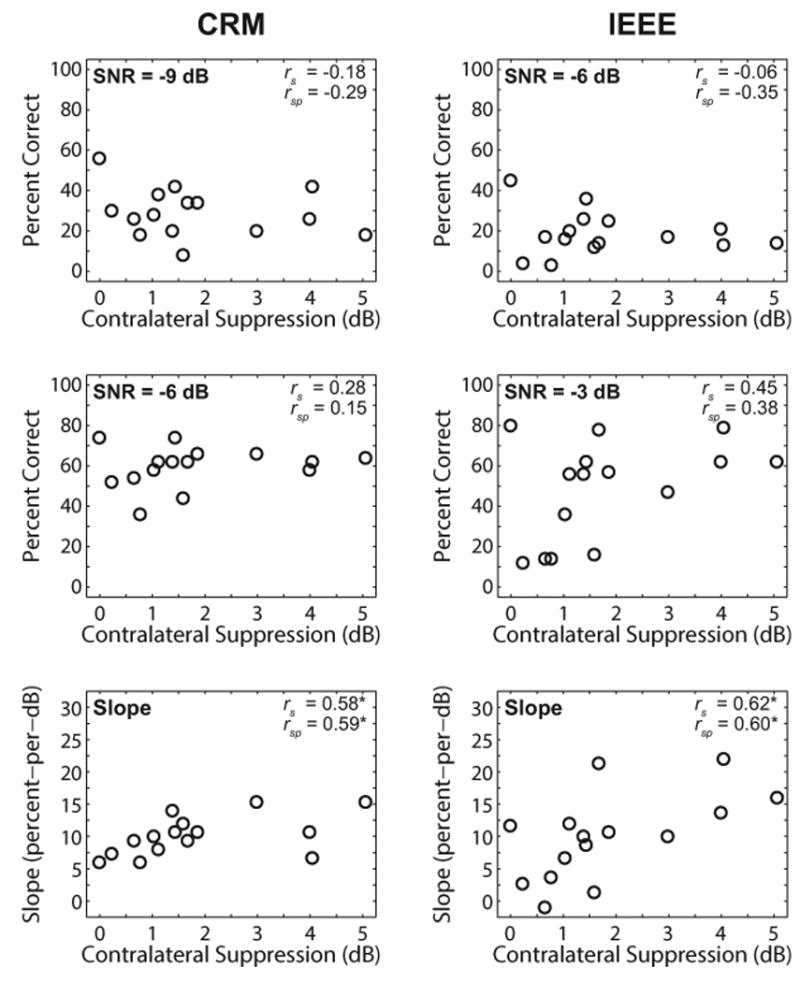
Fig. 5.

Associations between contralateral suppression and speech-in-noise performance. Left and right columns display results for the CRM and IEEE tests, respectively. The top and middle rows display percentage correct at the SNR displayed in the top left corner of each panel. The bottom row displays results for the slopes of the psychometric functions. Spearman correlation coefficients (rs) and partial correlation coefficients (rsp) are displayed in the top right corner of each panel. Asterisks denote correlations that were significant at p < 0.05. CRM indicates coordinate response measure; IEEE indicates Institute of Electrical and Electronics Engineers; SNR indicates signal-to-noise ratio.
