
Figure 3.
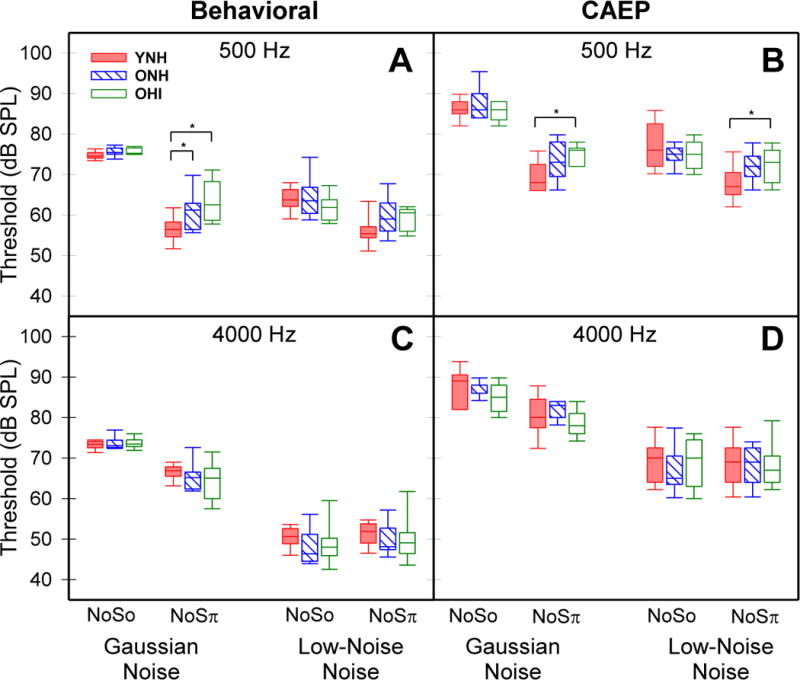
Behavioral and CAEP thresholds for 500-Hz (panels A, B) and 4000-Hz (panels C, D) conditions. Homophasic (NoSo), antiphasic (NoSπ), and noise (GN, LNN) conditions are indicated on the abscissa. Horizontal lines represent the median thresholds. Boxes span the 25th to 75th percentiles and vertical bars span the 10th to 90th percentiles. Groups are differentiated by color and box fill patterns with significant differences between groups (p< 0.05) indicated by bars and asterisks.