
Figure 4.
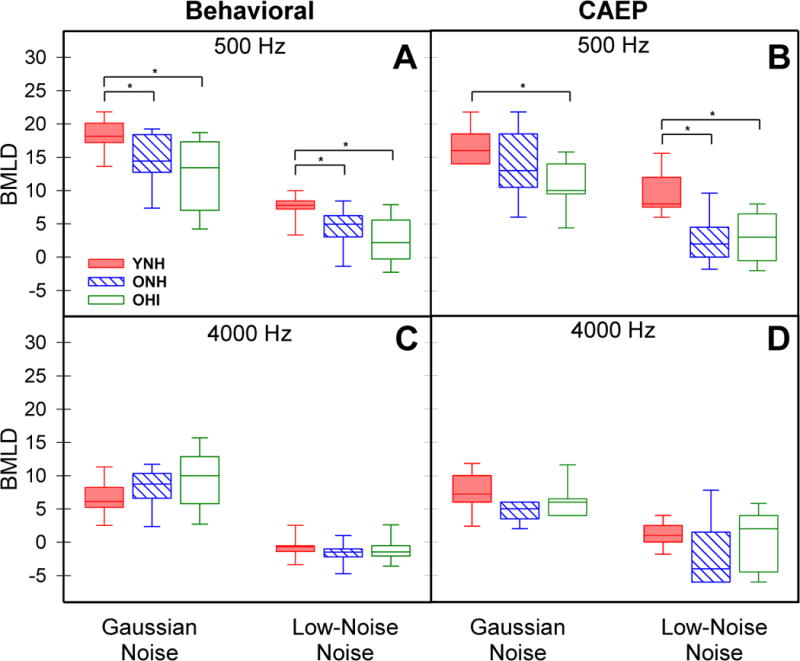
Behavioral and CAEP BMLDs derived from NoSo and NoSπ thresholds for 500-Hz (panels A, B) and 4000-Hz (panels C, D) conditions. Noise (GN, LNN) conditions are indicated on the abscissa. Groups are differentiated by color and box fill patterns with significant differences (p< 0.05) between groups indicated by bars and asterisks.