
Figure 6.
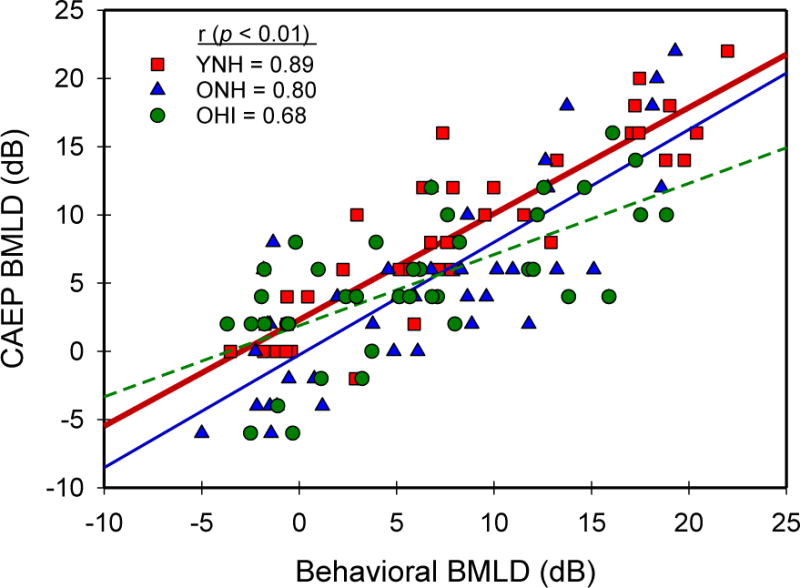
Scatterplot of behavioral and CAEP BMLDs for each participant across all 8 frequency, phase and noise conditions. Groups are differentiated by colored symbols and lines representing linear regression fits of the data. Pearson-product correlation values for each group are indicated in the inset. All correlations were significant (p< 0.01) for each group, and only the OHI group was significantly different (p< 0.01) from the other two groups (YNH, ONH).