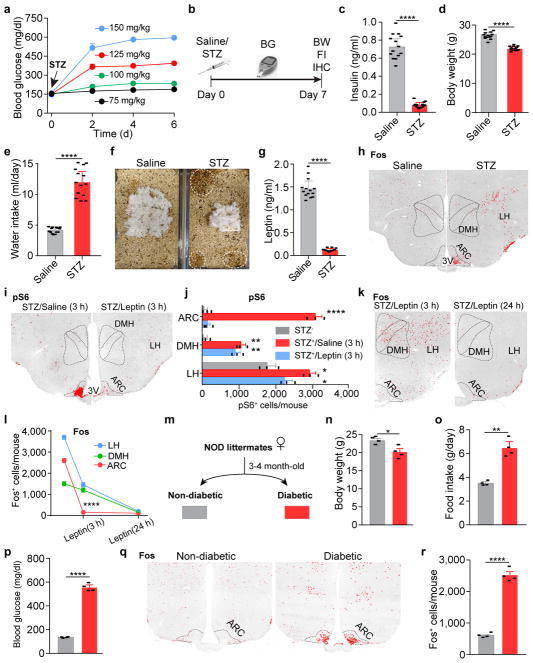
Extended Data Figure 1. Characterization of streptozotocin (STZ)-induced diabetic mice; Additional analysis of alterations in neuronal activity in STZ-treated animals and following leptin administration; Similar activation of neurons in the ARC was also observed in NOD diabetic mice.
a, Development of hyperglycemia in C57BL/6 mice after one-time i.p. administration of STZ at different doses from 75 mg/kg to 150 mg/kg (n=4 mice per group). 125 mg/kg was chosen for all of the following STZ-related experiments described in the current study. b, Experimental procedures. c–g, Serum insulin levels (c), body weight (d), daily water intake (e), representative cages in which a saline- and a STZ-treated mouse were housed, respectively (f), and serum leptin levels (g) after 1 week post STZ-injection (n=14 mice per group), suggesting that 125 mg/kg STZ-treatment effectively induces insulin-deficiency and diabetes, as well as emaciation, polydipsia, polyuria, and, importantly, leptin-deficiency. h, Representative sections of Fos immunostaining in the hypothalamus of saline- or STZ-treated mice. ARC, arcuate nucleus; DMH, dorsomedial hypothalamus; LH, lateral hypothalamus; 3V, 3rd ventricle. i, j, Representative sections and quantification of phosphorylated ribosomal protein S6 (Ser235/236, pS6) immunostaining in the mediobasal hypothalamus of saline- or STZ-treated mice 3 hours after the administration of saline/leptin (n=3 mice per group). k, l, Comparison of Fos expression in the mediobasal hypothalamus of STZ-treated mice following 3-hour or 24-hour leptin treatment (n=3 per group). m, Schematic diagram of the development of non-obese diabetic (NOD) mouse model. n–r, Body weight (n), daily food intake (o), ad libitum fed blood glucose levels (p), and representative sections (q) and quantification (r) of Fos immunostaining in the ARC of non-diabetic or diabetic NOD littermates (n=4 mice per group). Data are mean ± s.e.m. and representative of three independent experiments; *P<0.05, **P<0.01, ****P<0.0001; Student’s two-tailed, unpaired t-test (c–e, g, j, n, o, p, r) or two-way ANOVA analysis (l).

