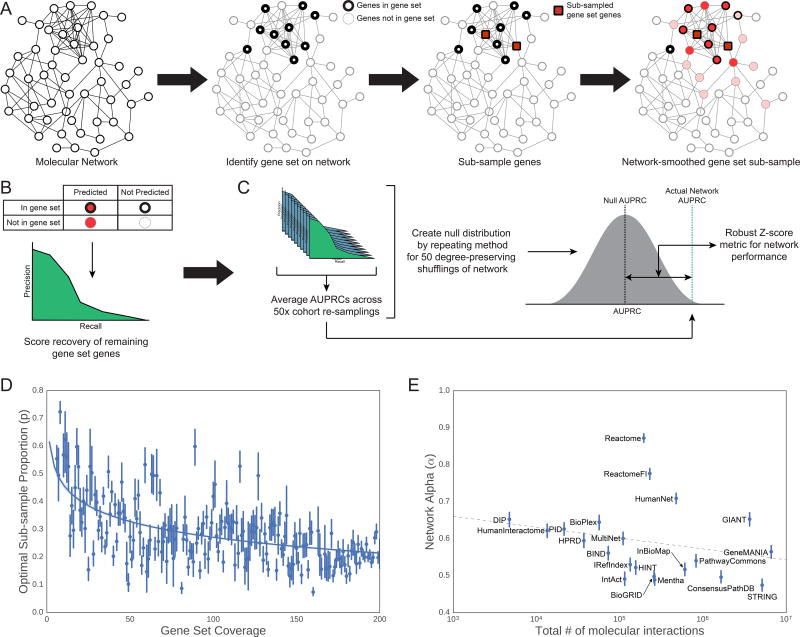
Figure 2. Set-Based Network Evaluation.
(A) A gene set of interest is sub-sampled (with proportion p) on the molecular network. Each sub-sample of genes is then propagated over the network of interest (with network propagation coefficient ɑ) to recover the remaining genes in the gene set. (B) The area under the precision-recall curve (AUPRC) is calculated to measure the performance of this recovery task. (C) For each network, a set of null models is created by shuffling network edges (while preserving node degree) and repeating steps (A) and (B). The final network performance metric on this gene set is the improvement over the distribution of the null models’ AUPRCs. (D) The subsampling rate p of each gene set was set by a function of the number of genes from the gene set also found in the network. We determined this relationship by fitting the log10-adjusted gene set coverage in the network versus the optimal sampling rate for recovering the mSigDB gene sets (Liberzon et al., 2011). (E) Similarly, the optimal amount of network propagation (ɑ) was fit by a linear model on the log10-adjusted number of edges in the network. For additional details see STAR Methods.

