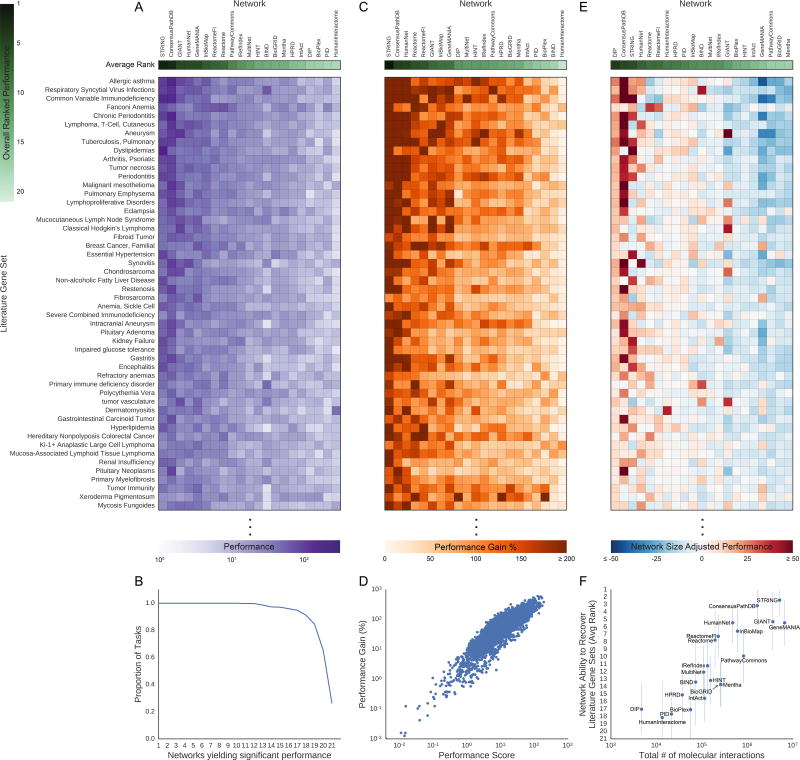
Figure 3. Molecular Network Recovery Performance of Literature Gene Sets.
(A) The network performance score (purple) on 50 selected literature gene sets. (B) The proportion of all 446 literature gene sets versus the number of networks have performed significantly better than their null networks via the network performance score (Bonferroni corrected p-value<0.05). (C) Network performance gain for 50 literature gene sets as shown in (A). This value represents the effect size of the improvement in gene set recovery performance due to using real networks over scrambled null networks. (D) The log10-adjusted network performance score of molecular networks compared to the log10-adjusted network performance score gain by the molecular networks over their respective null molecular networks recovering the literature gene sets. (E) Network size-adjusted performance scores for 50 literature gene sets as shown in (A). The columns (networks) in heatmaps (A), (C), and (E) are sorted by the average rank of the metric being measured (green rows). (F) The average ranked performance of each molecular network on the recovery of the expression gene sets compared to the log10-adjusted number of interactions in the molecular networks. The error bars are one standard deviation of the ranked network performances across the tasks. The methods to calculate the described metrics above (network performance score, network performance gain, network size-adjusted performance score, and average ranked performance) are described in the STAR Methods. See also Figure S3, Figure S4 and Data S1.

